 Reproduced, with permission, from: Tucker, C. J., H. E. Dregne, and W. W.
Newcomb. 1991. Expansion and contraction of the Sahara Desert between 1980 and
1990. Science 253: 299-301.
Reproduced, with permission, from: Tucker, C. J., H. E. Dregne, and W. W.
Newcomb. 1991. Expansion and contraction of the Sahara Desert between 1980 and
1990. Science 253: 299-301.
COMPTON J. TUCKER, HAROLD E. DREGNE, WILBUR W. NEWCOMB
Data from polar-orbiting meteorological satellites have been used to determine the extent of the Sahara Desert and to document its inter annual variation from 1980 to 1990. The Sahara Desert ranged from 8,633,000 square kilometers in 1980 to 9,982,000 square kilometers in 1984. The greatest annual north-south latitudinal movement of the southern Saharan boundary was 110 kilometers from 1984 to 1985 and resulted in a decrease in desert area of 724,000 square kilometers.
THE LARGEST DESERT OF OUR PLANET, the Sahara of Africa, is between ~7,000,000 and ~9,000,000 km2 in area. The northern boundary has been arbitrarily set to follow the south side of the Atlas Mountains to Biskra (Algeria) where it dips southward through Tunisia to the Gulf of Gabes and from there continues along the Mediterranean to the Suez Canal (1). The southern boundary stretches east to west at ~16deg. to 17deg.N for 6000 km from the Atlantic Ocean in Mauritania to the Red Sea in Sudan and is a vegetation-zone boundary. At this boundary there is an almost insensible gradient of plants, animals, and physiographic characteristics into steppe vegetation of the Sahel zone (2, 3) resulting from a mean annual precipitation gradient of ~l mm year-1 km-1 from north to south. Uncertainty in and variation of the location of the boundary between the Sahara and the Sahel zone has prevented precise estimates of the extent of the Sahara (4).
Although deserts share a number of features (climate, weather, and a low density of vegetation), most workers have defined "desert" according to their discipline (5, 6). We use a desert" to be synonymous with "arid" "SemiArid" represents the gradation of desert into "steppe" and denotes areas of less aridity, higher and more evenly distributed rainfall, and higher levels of primary production. "Steppe" is also imprecise, and its use varies widely (6).
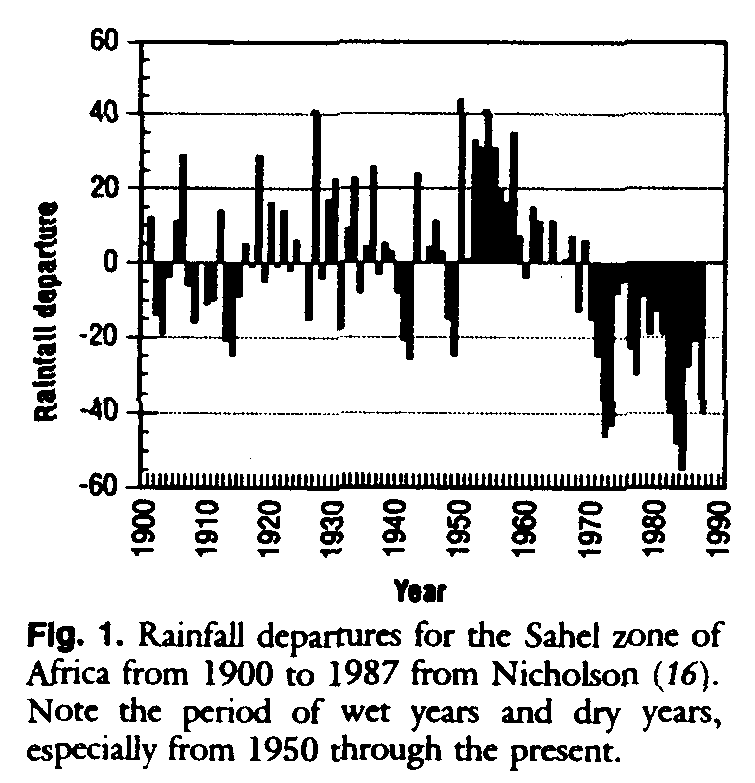
Largely anecdotal information suggests that the Sahara has expanded toward the south (7-12). The alleged expansion was attributed in part to climate variation (droughts) (13) and to land mismanagement such as overgrazing, increased cultivation, and firewood cutting (8,11) . This process of land degradation is called "desertification" by some (14) and "desertization" by others (15). The occurrence of a period of wet years (1950 to 1968) followed by dry years (1969 to 1990) has also contributed to the controversy over the location of the southern Sahara boundary (Fig. 1) (16-18).
Lamprey (12) compared the location of the southern boundary of desert vegetation in western Sudan in 1958 with its location in 1975. He estimated that the boundary had shifted southward by 90 to 100 km during the 17-year period, a desert expansion of~5.5 km year- l; this value has been repeated often in the popular press (9-11). However, a 1984 field study by Hellden (19) in the same area found no evidence of such an expansion.
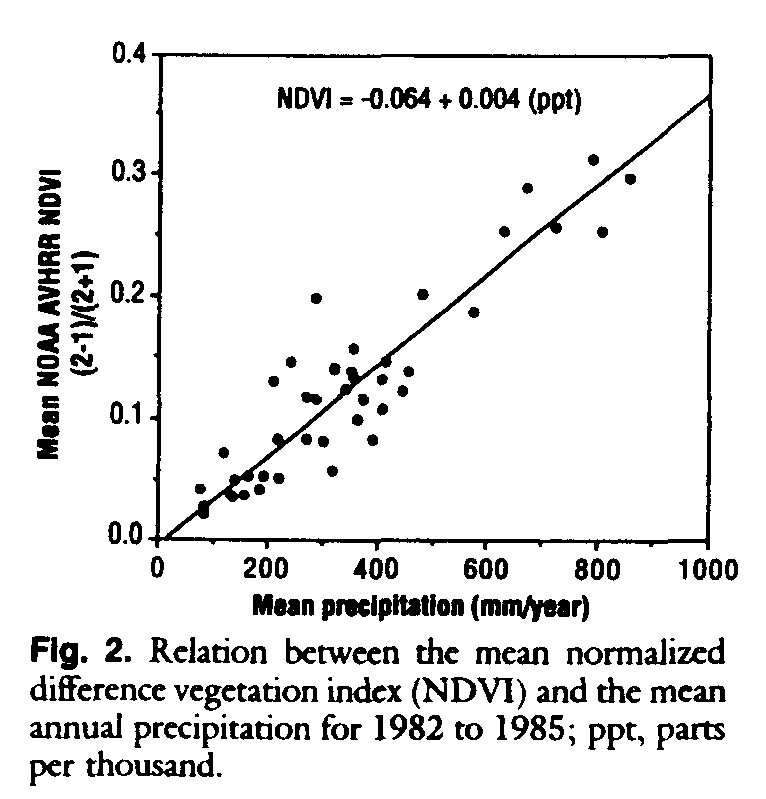
In order to measure directly the changes in vegetation at this boundary, we used a satellite-derived vegetation index to map inter annual changes in vegetative cover and, by inference, rainfall, along the Saharan-Sahelian boundary from the Atlantic Ocean to the Red Sea for the period 1980 to 1990. We hypothesized that annual variations in rainfall would bring corresponding changes in the density of vegetative cover. Malo and Nicholson (20) have shown that the satellite-derived vegetation index we used is linearly related to precipitation in the area of our study (Fig. 2).
Vegetation indices are spectral measures derived from remotely sensed data in the red and near-infrared spectral regions. The red spectral response is inversely related to the chlorophyll density, and the near-infrared spectral response is directly related to scattering in individual leaves and between leaves in the canopy. Combining data from these two adjacent spectral regions compensates for differences in irradiance and provides an estimate of the intercepted fraction of the photosynthetically active radiation or photosynthetic capacity (21). These data are also strongly related to total primary production when summed or averaged over the growing season (22). We used a satellite-derived vegetation index calculated from meteorological satellite data and expressed this index in terms of estimated annual precipitation (Fig. 2).
The area we studied lies between 16deg.W and 39deg.E longitude and 10deg. and 25deg.N latitude. This area includes a sizable part of the Sahara Desert as well as the Sahel (23-25). We will use the 200 mm year-l precipitation isoline as the boundary between the Sahara Desert and the Sahel zone, realizing that this is actually the boundary between the Sahel proper and the Saharan-Sahelian transition zone. This is unavoidable as the utility of our satellite vegetation index approach is limited below the - 150 to 200 mm year-1 precipitation isoline because of limited green vegetation.
Satellite data from the U.S. National Oceanic and Atmospheric Administration's (NOAA) polar-orbiting meteorological satellites were used from 1980 to 1990. Data from the advanced very high resolution radiometer (AVHRR) channel 1 (0.55 to 0.68 mm), channel 2 (0.73 to 1.1 mm), and channel 5 (11.5 to 12.5 mm) were used to calculate the normalized difference vegetation index (NDVI) (26).
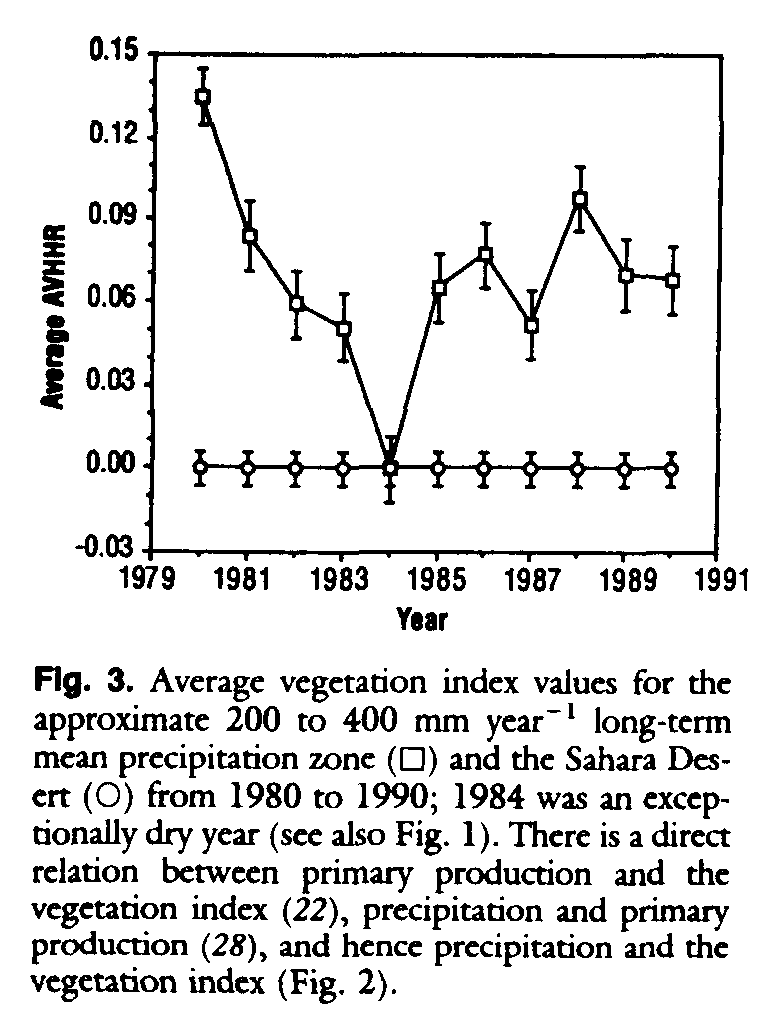
The NDVI was computed for the Sahel zone as well as for a 1,000,000 km2 area of the central Sahara and plotted against year (Fig. 3). Rainfall and hence primary production decreased progressively from 1980 to 1984 in the
Sahel zone (Figs. 1 and
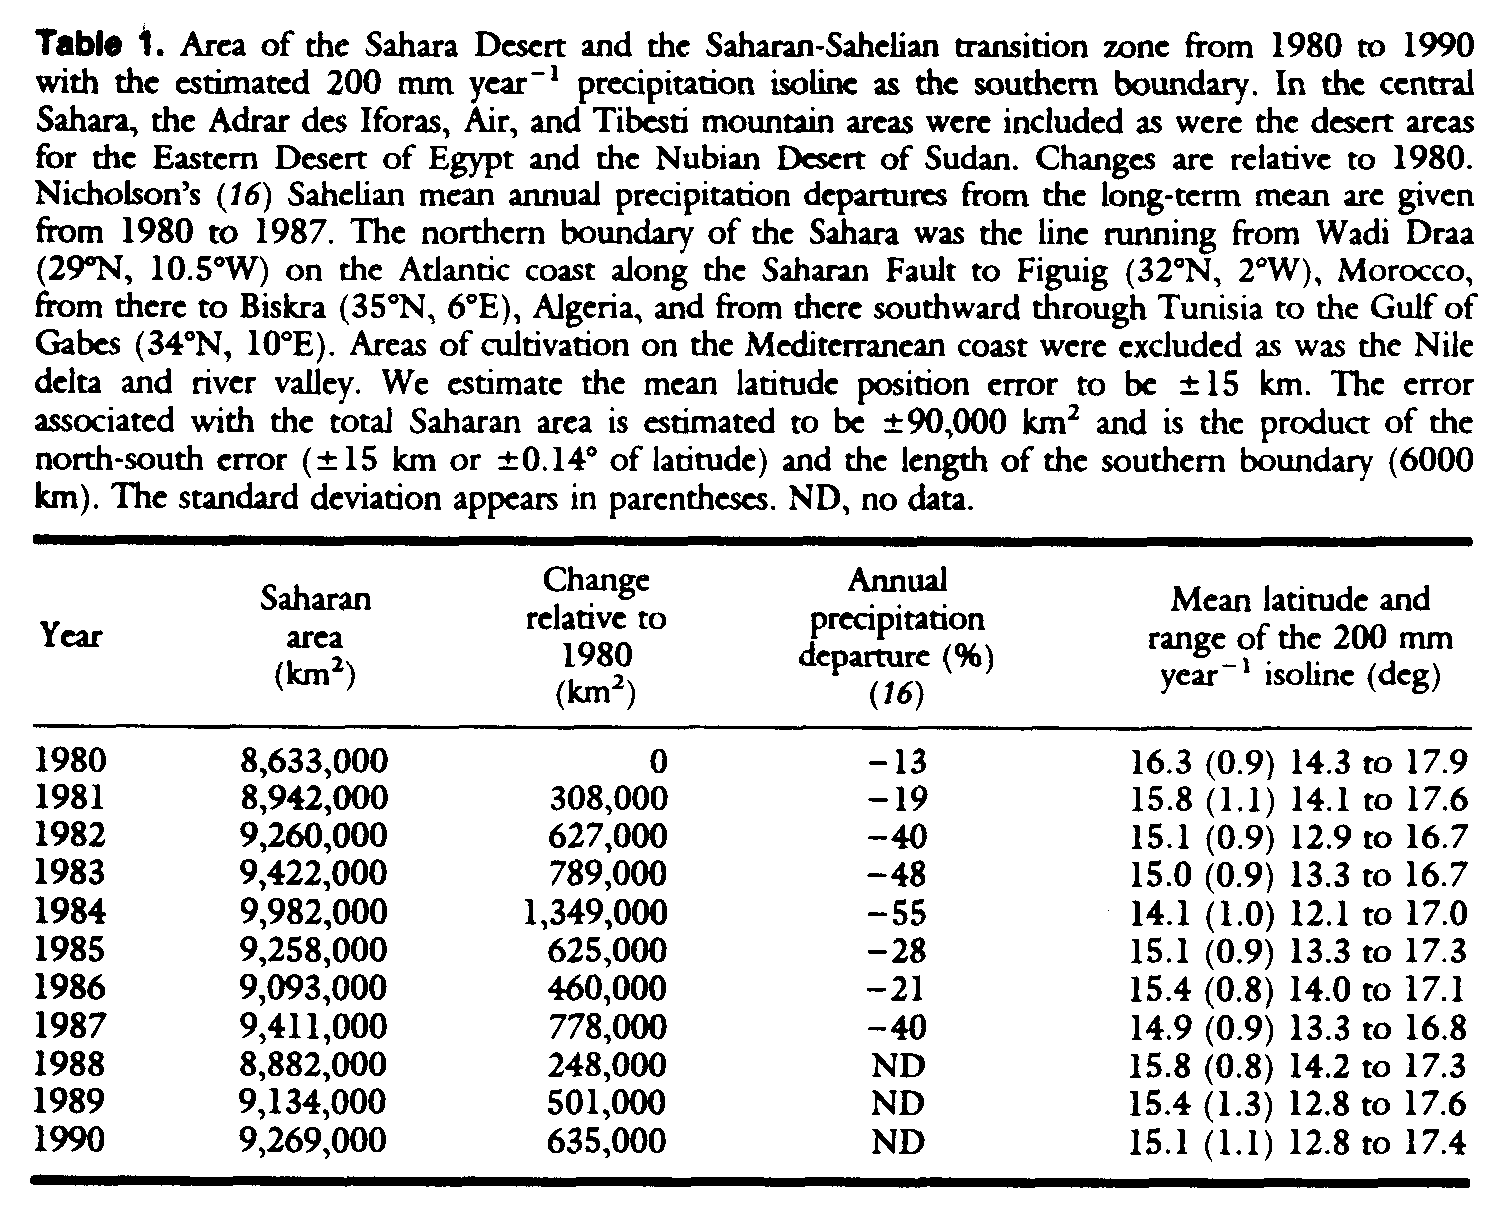
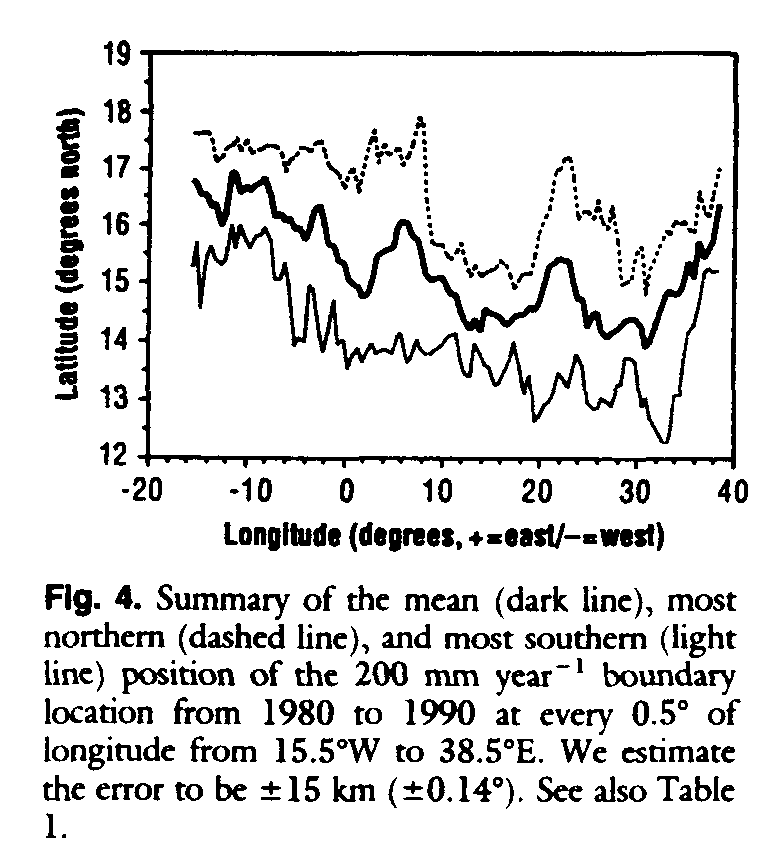
Our data document a progressively southward movement of the Saharan-Sahelian boundary (the 200 mm year- l precipitation isoline) from 1980 to 1984 of 240 km (~60 km year-1). We computed this rate by averaging the boundary location at each half degree of longitude from 15.5deg.W to 38.5deg.E (Table 1). We estimate that the error associated with our boundary determination is +2 pixels or 15 km.
The average southward movement of the Saharan-Sahelian boundary (the 200 mm year- l annual precipitation isoline) from 1980 to 1981 was 55 km, from 1981 to 1982 was 77 km, from 1982 to 1983 was 11 km, and from 1983 to 1984 was 99 km. From 1984 to 1985 there was south-to-north movement (retreat of the desert) of 110 km followed by a further northward movement from 1985 to 1986 of 33 km. In 1987 the mean position moved southward 55 km. In 1988, it moved northward 100 km; in 1989 and 1990 it again moved southward 44 and 33 km, respectively. The mean position in 1990 was thus ~ 130 km south of its position in 1980. Desert expansion varied in the 11 years of our analysis from 248,000 km2 (1988) to 1,349,000 km2 (1984), all relative to 1980. The 1984 expansion represents a 15% increase in the size of the Sahara as compared with 1980. We estimated that the area of the Sahara and the Sahara Sahelian transition zone was 8,633,000 km2 in 1980 (Table 1).
The north-south movement of the 200 mm year-1 isoline varied greatly across the south side of the Sahara (Fig. 4). Variation was high from Mali through central Niger and from eastern Chad through western Sudan. Variation was low in southern central and southeastern Mauritania and from central Niger through western Chad. Rainfall, and hence vegetation distributions, vary in space as well as in time in this area.
The observed low variability in the interannual movement of the 200 mm year-1 isoline in Mauritania and from central Niger through western Chad has implications for detecting desertification The ability to detect changes should increase in areas of lower interannual variability. Interannual variations mean that it would require a decades-long study to determine whether long-term expansion or contraction of the Sahara is occurring. Our data provide a baseline for comparison with future data (27).
C.J. Tucker and W. W. Newcomb, Laboratory for Terrestrial Physics, Nabonal Aeronautics and Space Administration Goddard Space Flight Center, Greenbelt, MD 20771
H. E. Dregne, International Center for Arid and SemiArid Land Studies, Texas Tech University Lubbock, TX 79409.
2. H. N. Le Houerou,J. Range Manage. 33, 41 ( 1980).
9. J. Smolowe, Time 127 (no. 33), 36 (1987).
10. C. Norman, Science 235, 963 (1987).
11. W. S. Ellis, Natl. Geogr. 172, 140 (1987).
13. S. E. Smith ,J. Soil Water Conserv. 41, 297 (1986).
15. H. N. Le Houerou, Ann. Alger. Geogr. 6, 2 (1968).
16. S. E. Nicholson, Weather 44, 47 (1989).
17. P. J. Lamb, R. A. Peppler, S. Hastenrath, Nature 322, 238 (1986).
18. C. Toupet, C. R. Somm. Seances Soc. Biogeogr. 48, 39 (1972).
20. A. R. Malo and S. N. Nicholson, J. Arid Environ. 19, 24 (1990).
24. F. White, The Vegetation of Africa (Unesco, Pans, 1983).
25. H. Bremen and C. T. de Wit, Science 221, 1341 ( 1983).
29. We thank D. Rosenfedler, J. Rosenfedler, and R. Rank for assistance.REFERENCES AND NOTES