 Reproduced, with permission, from:
Gallo, K. P., A. L. McNab, T. R. Karl, J. F . Brown, J. J. Hood, and J. D. Tarpley. 1993. The use of NOAA AVHRR data for assessment of the urban heat island effect. Journal of Applied Meteorology 32 (5): 899-908.
Reproduced, with permission, from:
Gallo, K. P., A. L. McNab, T. R. Karl, J. F . Brown, J. J. Hood, and J. D. Tarpley. 1993. The use of NOAA AVHRR data for assessment of the urban heat island effect. Journal of Applied Meteorology 32 (5): 899-908.
(Manuscript received 21 May 1992, in final form 23 October 1992)
ABSTRACT
A vegetation index and a radiative surface temperature were derived from satellite data acquired at approximately 1330 LST for each of 37 cities and for their respective nearby rural regions from 28 June through 8 August 1991. Urban-rural differences for the vegetation index and the surface temperatures were computed and then compared to observed urban-rural differences in minimum air temperatures. The purpose of these comparisons was to evaluate the use of satellite data to assess the influence of the urban environment on observed minimum air temperatures (the urban heat island effect). The temporal consistency of the data, from daily data to weekly, biweekly, and monthly intervals, was also evaluated. The satellite-derived normalized difference (ND) vegetation-index data, sampled over urban and rural regions composed of a variety of land surface environments, were linearly related to the difference in observed urban and rural minimum temperatures. The relationship between the ND index and observed differences in minimum temperature was improved when analyses were restricted by elevation differences between the sample locations and when biweekly or monthly intervals were utilized. The difference in the ND index between urban and rural regions appears to be an indicator of the difference in surface properties (evaporation and heat storage capacity) between the two environments that are responsible for differences in urban and rural minimum temperatures. The urban and rural differences in the ND index explain a greater amount of the variation observed in minimum temperature differences than past analyses that utilized urban population data. The use of satellite data may contribute to a globally consistent method for analysis of urban heat island bias.
1. Introduction
The development of temperature differences between cities and their surrounding rural regions has been well documented (Landsberg 1981). The influence of urbanization on long-term temperature records (the urban heat island effect) has been detected even for cities with populations less than 10 000 (Karl et al. 1988). Urbanization within the United States has had the greatest influence on minimum (compared to maximum or mean) temperature records (Karl et al. 1988). Changnon (1992) presents a review of additional climatic modifications attributed to urbanization.
The difference between instrument-level (approximately 1.5 m) air temperatures observed in an urban, compared with its surrounding rural, environment depends on numerous factors (Lowry 1977; Oke 1978). Carlson et al. (1981) proposed that the heat storage differences between the materials that are associated with urban and rural surfaces are responsible for the development of the observed air temperature differences. The concrete and asphalt associated with urban areas store the heat absorbed during the day and transfer it to the atmosphere at night. The materials that store and release heat at night within rural regions may vary at different times of a year, and include bare soil and vegetated or snow-covered surfaces. During the growing season, vegetated surfaces with adequate moisture availability redistribute much of the energy absorbed during the day through evapotranspiration. The heat stored and available for release at night is thus less than that within the less vegetated urban heat island. During the nonvegetated months, the urban and rural temperature differences are still present (Karl et al. 1988) due to likely storage differences and "waste heat" lost from the internally heated structures of the urban areas.
Efforts have been made to adjust temperature records for the bias caused by urban buildup around weather stations located in and near cities. One method for evaluation and adjustment of the urban heat island (UHI) bias of climatological temperatures requires "pairs" of urban and rural weather stations (Kukla et al. 1986; Karl et al. 1988). The majority of the research on the removal of UHI bias has occurred in the United States because of the availability of long-term urban and rural temperature records. A globally applicable methodology for assessing the UHI bias is needed to remove this bias from future temperature records in regions where pairs of urban and rural weather stations are not available.
The use of urban population as a predictor of the amount of UHI bias has been studied (Oke 1973; Oke 1982; Karl et al. 1988). Oke (1973) examined relationships between the urban and rural temperature bias and population statistics of North American and European cities and identified two different relationships for the two continents. Other limitations to the use of population statistics as an estimator of the UHI bias include the lack of globally consistent statistics. Additionally, population data given for a geographically arbitrary boundary can be difficult to relate to the population in the immediate vicinity of a weather station. Thus, population alone does not appear to be a globally applicable method for evaluating and removing the UHI bias.
Satellite-derived surface temperature data have been utilized for urban climate analyses in several studies (Rao 1972; Carlson et al. 1977; Matson et al. 1978; Price 1979; Kidder and Wu 1987; Roth et al. 1989; Carnahan and Larson 1990). Rao (1972) was the first to demonstrate that urban areas could be identified from analyses of thermal data acquired by a satellite. Matson et al. (1978) utilized Very High Resolution Radiometer (VHRR) thermal data (10.5-12.5 m) acquired at night to examine urban and rural surface temperature differences. Price (1979) utilized Heat Capacity Mapping Mission (HCMM) data (10.5-12.5
m) to assess the extent and intensity of urban surface heating in the northeastern United States.
Roth et al. (1989) utilized Advanced Very High Resolution Radiometer (AVHRR) thermal data (10.5-11.5 m) to assess the urban heat island intensities of several cities on the west coast of North America. Daytime thermal patterns of surface temperature were associated with land use; higher surface temperatures were observed in industrial areas than in vegetated regions. Nighttime observations revealed little difference in surface temperatures of urban and rural regions, which suggests that the sides of buildings (rather than roofs) and the characteristics of other urban features may contribute to the higher minimum temperatures observed in urban compared to rural regions.
The greatest urban and rural air temperature differences are observed at night, while the greatest differences in surface radiant temperature are observed during midday (e.g., Roth et al. 1989). Additional land surface properties, beyond surface temperature, may provide more information related to the factors that contribute to the observed UHI effect.
The reduced amount of heat stored in the soil and surface structures in rural areas covered by transpiring vegetation, compared to the relatively unvegetated urban areas, has been cited as a significant contributor to the UHI effect (Carlson et al. 1981; Goward 1981). Thus, a measure of the difference in density of urban and rural vegetation may be an indicator of the magnitude of the differences observed in the minimum air temperatures of urban and rural areas. Vegetation indices computed from remotely sensed data have been demonstrated as useful estimators of the amount of leaf area and related variables associated with agricultural crops (Gallo and Daughtry 1987; Asrar et al. 1989; Wiegand et al. 1990; Daughtry et al. 1992), as well as forests (Peterson and Running 1989; Running et al. 1989; Curran et al. 1992).
The objectives of this study were to evaluate the use of a satellite-derived vegetation index and an estimate of surface temperature for assessment of the difference in urban and rural air temperature due to the urban heat island effect. The objectives included an evaluation of the temporal consistency of the data from daily to weekly, biweekly, and monthly intervals. Estimation of the bias created by the urban heat island effect may provide for potential adjustments to future temperature records and improved evaluation of the "greenhouse effect" on future temperature records.
2. Data analysis
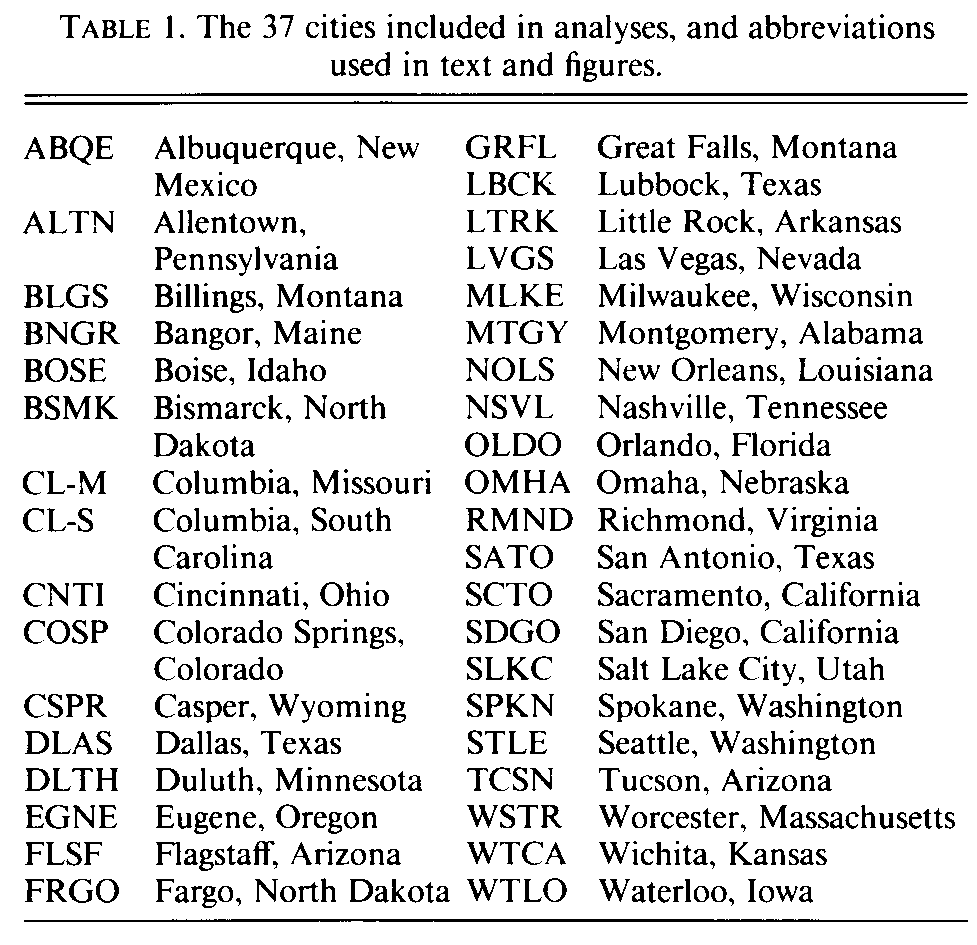
Thirty-seven cities (Table 1) were selected, one from each square of a 5deg. X 5deg. grid over the conterminous United States, to assure an approximately uniform spatial distribution of the cities. The cities and their associated rural regions included a variety of land surface features (deserts, agricultural, rangeland, and forests). The selected cities were also diverse in their physical dimensions. Populations of the cities included in the analyses ranged from less than 50 000 (Flagstaff, Arizona) to greater than 3 000 000 (Dallas, Texas) (USDC 1991; Rand McNally 1992).
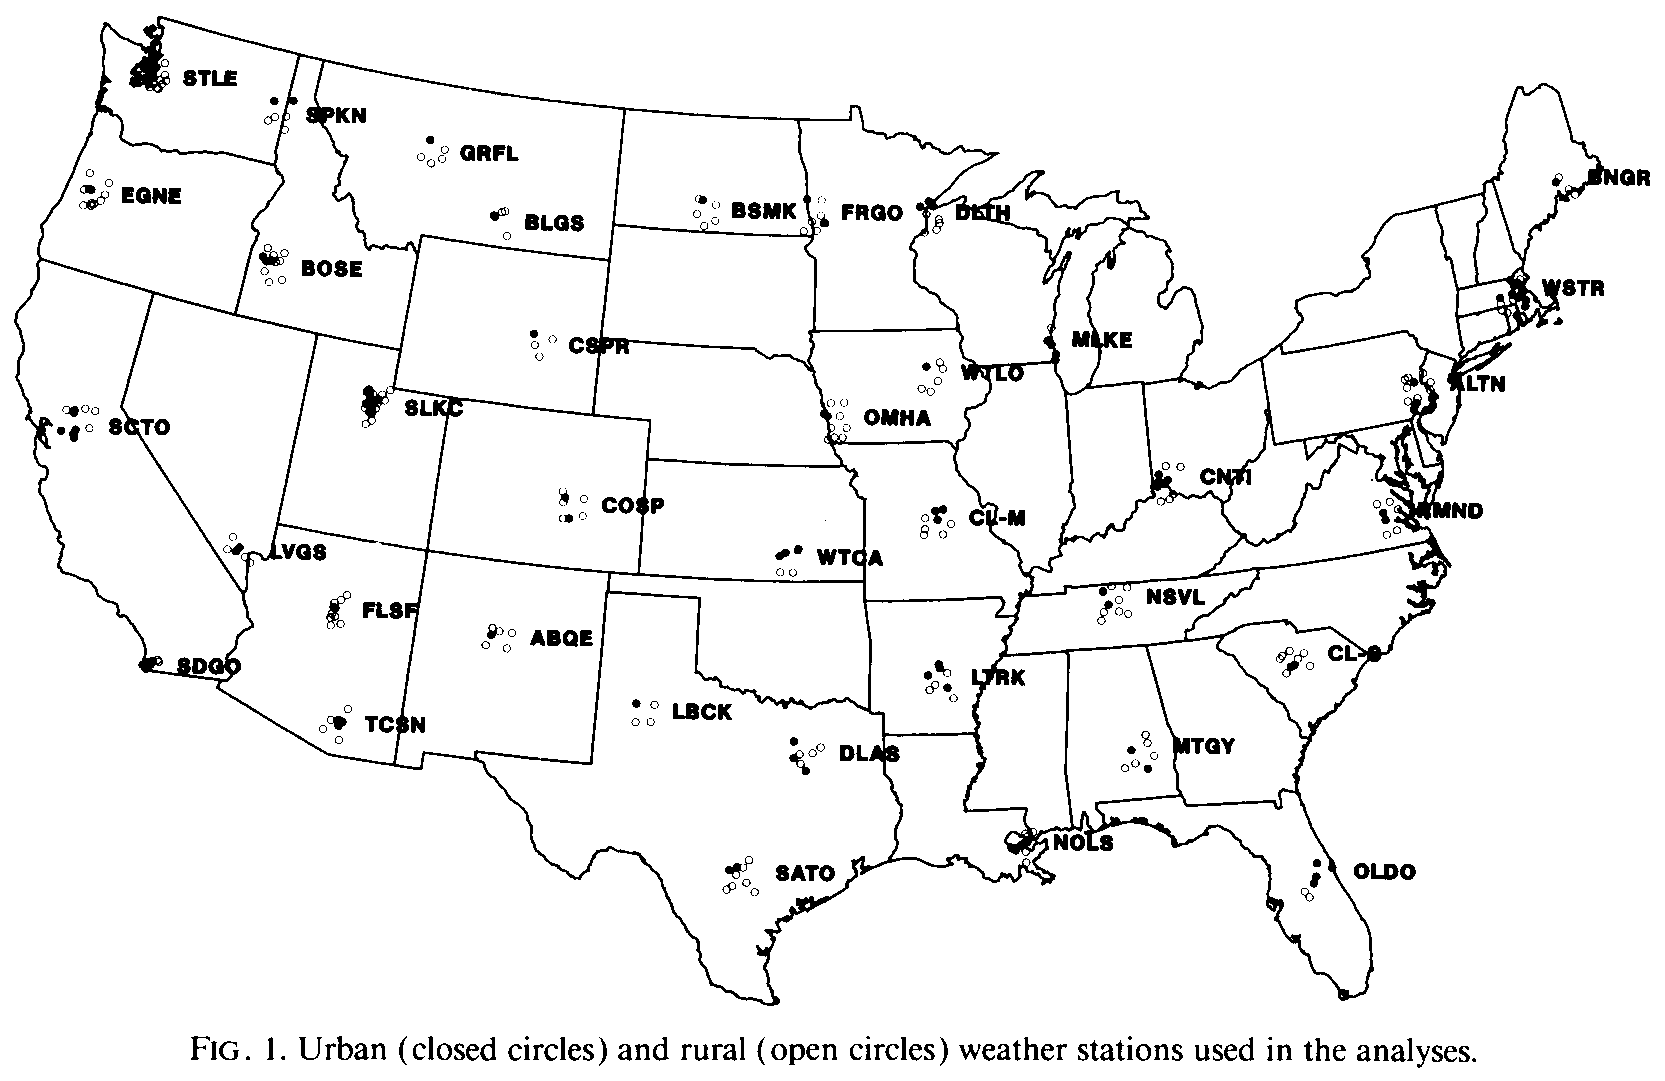
The daily minimum air temperatures (Tmin) for June, July, and August of 1991 were obtained for urban and rural weather stations of the U.S. Cooperative Station Network that were located within a 1deg. latitude-longitude square centered on the selected cities. Temperature data from a total of 322 stations (Fig. 1) were used in the analyses.
Five of the stations (less than 2% of total) were located on rooftops. These stations represented only one of several samples used to compute the urban (or rural) climate of the five cities (BNGR, CNTI, SCTO, SDGO, and WSTR) in which they were located. Thus, the impact of the station location on the computed urban (or rural: BNGR) temperature was judged to be negligible.
Thirty-nine percent (127) of the stations used the maximum-minimum temperature system (MMTS) thermistor sensors. Quayle et al. (1991) estimated that during the summer months the MMTS sensors averaged 0.3deg.C above the minimum temperature observed with a liquid-in-glass minimum thermometer. The use of an "adjustment factor," however, was recommended as appropriate for application only on a monthly, seasonal, or annual basis, not for daily temperature records. Thus, no adjustments were made to the MMTS data used in this study.
Each weather station was manually classified based on the environment that surrounded the station. Major classes included urban (population greater than 50 000) and rural (population less than 10 000) stations. Stations located in cities with populations less than 10 000, yet adjacent to urban areas, were considered urban. Subclasses included small urban (population 10 000-49 000) and suburban (population less than 50 000); however, these classes were used only for analyses of individual cities.
Satellite-derived data used in this study included full resolution (1.1 km at nadir) single date scenes acquired by the AVHRR on board the NOAA-11 satellite during 28 June-8 August 1991, and weekly and biweekly composite products for the same interval. The data were acquired at approximately 1330 LST. The data were acquired and processed, and products produced, at the U.S. Geological Survey (USGS) Earth Resources Observation System (EROS) Data Center (EROS 1990). Individual AVHRR scenes were screened, based on cloud conditions within the scene, on a daily basis during 1991 for inclusion in the weekly and biweekly products. The daily AVHRR scenes that were primarily cloud-free were geometrically registered to a Lambert azimuthal equal-area map projection. Each map cell of the georegistered products represents 1 km[2]. The normalized difference (ND) vegetation index,
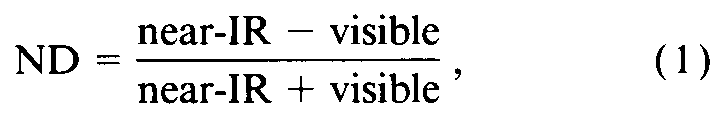
was computed from visible (0.58-0.68 m) and near-IR (0.72-1.1
m) data of the AVHRR. The visible and near-IR data were calibrated with modified prelaunch calibration coefficients recommended by Holben et al. (1990). Vegetation indices, including the ND, are indicators of the presence and density of green vegetation and have been successfully used to monitor seasonal vegetation activity (Goward et al. 1985; Malingreau 1986; Gallo and Flesch 1989). Nonvegetated surfaces--for example, water and clouds--have low or negative ND values. The ND computed for the daily AVHRR scenes was used to screen the data for each map cell such that the "greenest" or most cloud-free data value of each week or biweek was retained for each map cell in the composite products.
Calibrated thermal IR data of channels 4 (T4; 10.3-11.3 m) and 5 (T5; 11.5-12.5
m) on the NOAA AVHRR were used to estimate apparent surface temperature [Tsfc; Eq. (2)] as

for a surface emissivity of 1.0, as described by Price (1990). Surface emissivity differences between urban and rural regions, although likely, were not available and thus not included in computation of Tsfc, Oke (1978) cited emissivity values for vegetation (agricultural crops; deciduous and coniferous forests) that ranged from 0.90 to 0.97, while values for urban materials (concrete, asphalt, and stone) ranged from 0.71 to 0.95. Roth et al. (1989) estimated that the suppressed differences in Tsfc, due to unaccounted differences in emissivity, could be as much as 1.5deg.C. The visible, near-IR, and thermal IR data were not adjusted for atmospheric properties because relative, rather than absolute, differences in the vegetation index and Tsfc were computed. Roth (1989) suggested, based on Carlson (1986), that the error in relative temperature differences due to horizontal differences in atmospheric properties between urban and rural regions was approximately 1deg.C or greater.
The visible, near-IR, and thermal IR data were sampled for 3-pixel x 3-pixel windows centered on each weather station of each urban area included in the study. Data acquired over water bodies, as defined by USGS digital data (USGS 1991a), were excluded from analyses. No additional attempts, beyond the use of composite products, were made to screen the daily data for cloud contamination. During analysis of the composite data, cities with ND or Tsfc values indicative of the presence of clouds were excluded from further analysis. Urban and rural differences in daily, weekly, biweekly, and monthly values of Tsfc and the ND index were computed for each urban area and compared to urban and rural differences in selected daily, weekly, biweekly, and monthly means of Tmin.
3. Results and discussion
a. Temporal consistency of daily urban and rural satellite and surface data
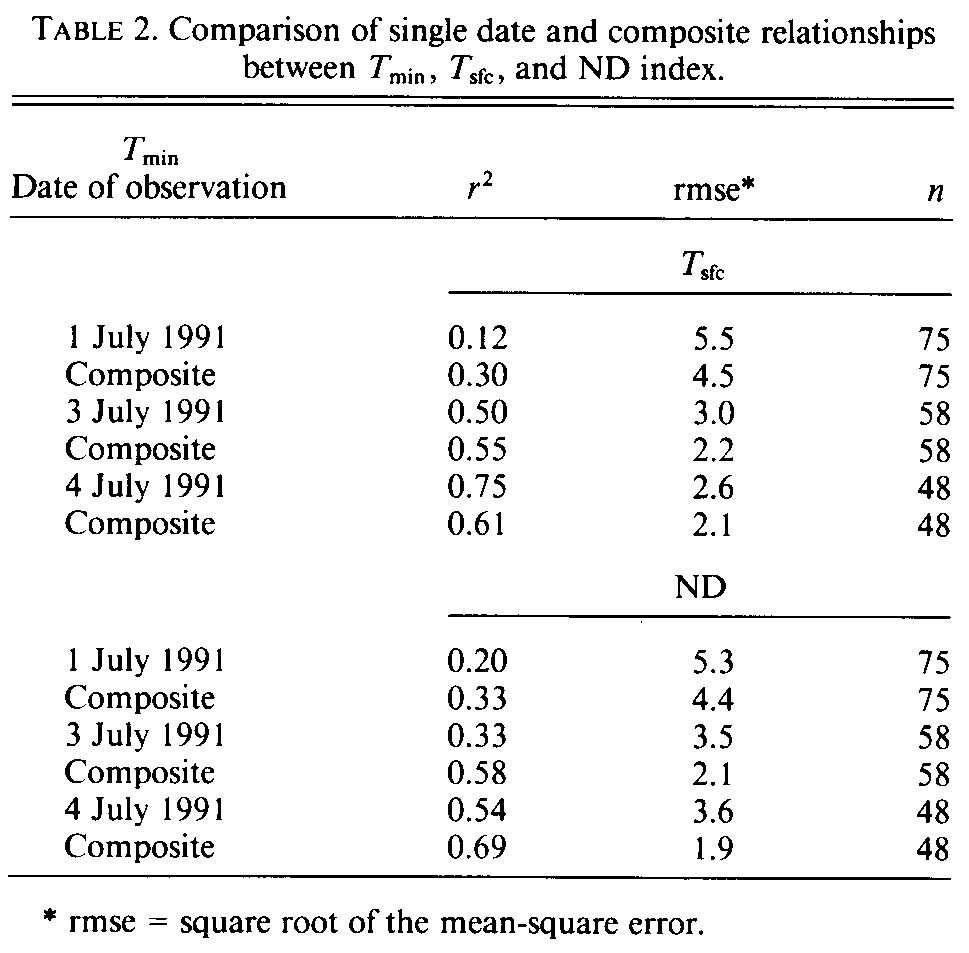
Satellite data for all 37 cities were not available for direct comparison with observed station temperatures on a daily basis due to cloud contamination. Initial analyses were focused on the 28 June through 4 July 1991 interval to provide a cursory evaluation of data of single scenes (dates) compared with data of weekly composites based on the ND index. The ND index and Tsfc were sampled from 1, 3, and 4 July, as these dates exhibited clear conditions for the greatest number of the 37 UHI cities. Relationships between Tmin, Tsfc, and the ND vegetation index were examined for each single date and compared to the weekly composite data of Tsfc, ND, and mean weekly Tmin. The amount of variation in Tmin associated with variation in ND was consistently greater for the weekly composite data than for data derived from single dates (Table 2). Similar results were obtained when Tsfc was examined, although on one of the three dates examined (4 July) the daily Tsfc data explained a greater amount of variation in Tmin than did the composite Tsfc data (Table 2).
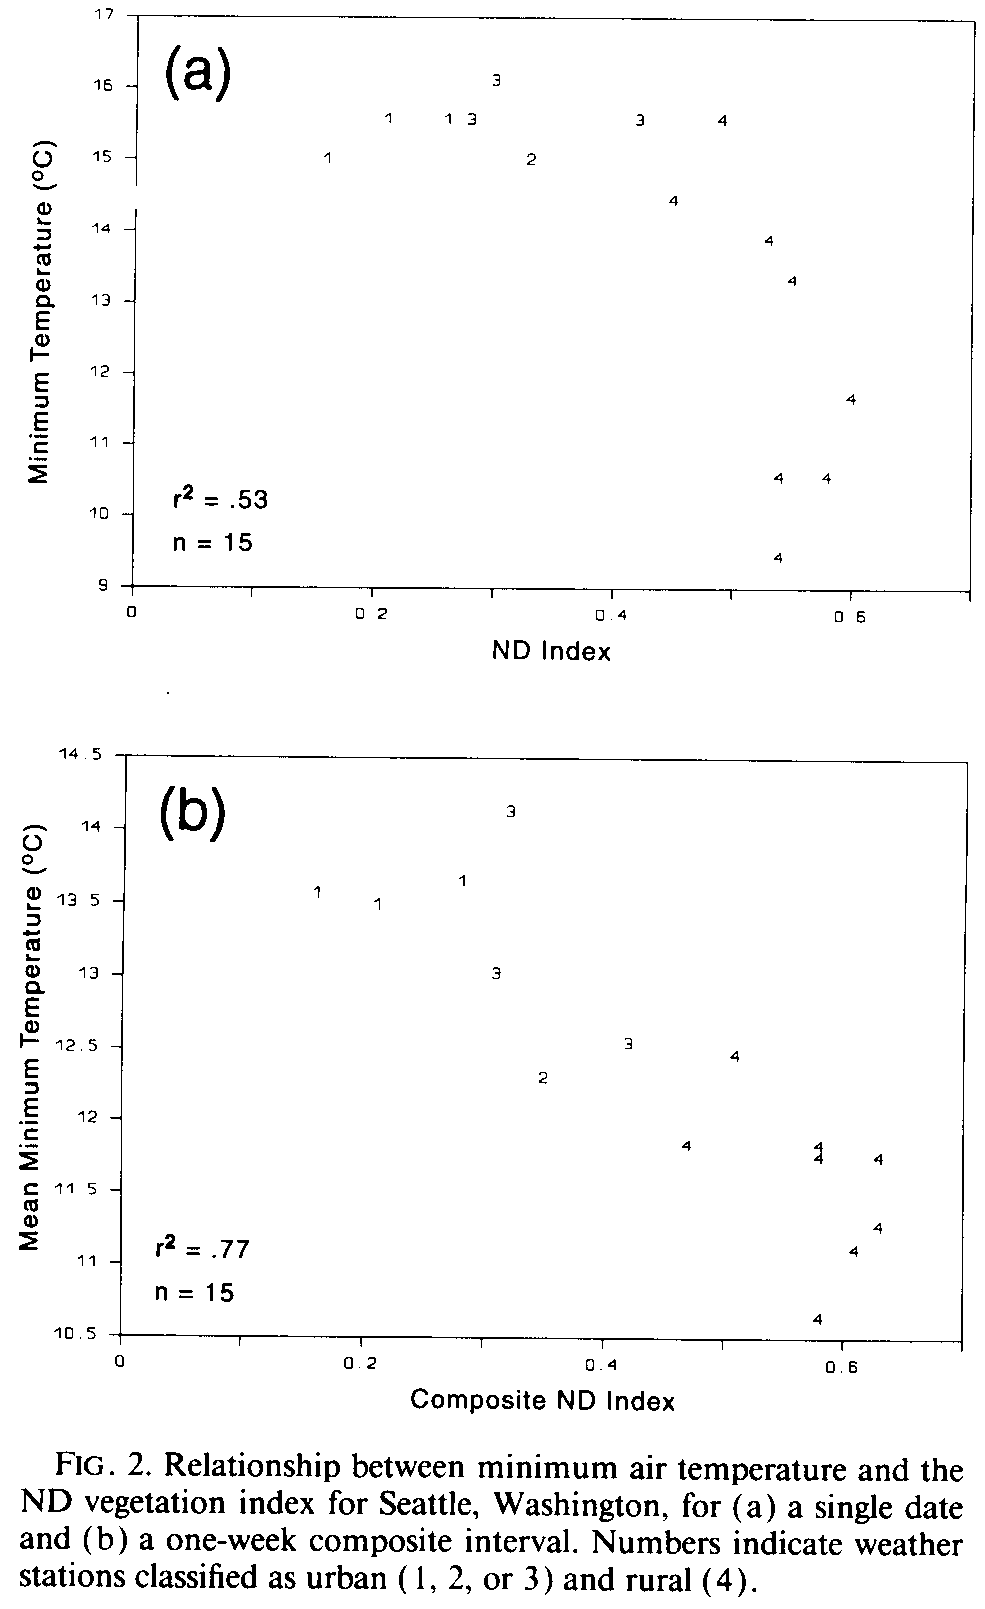
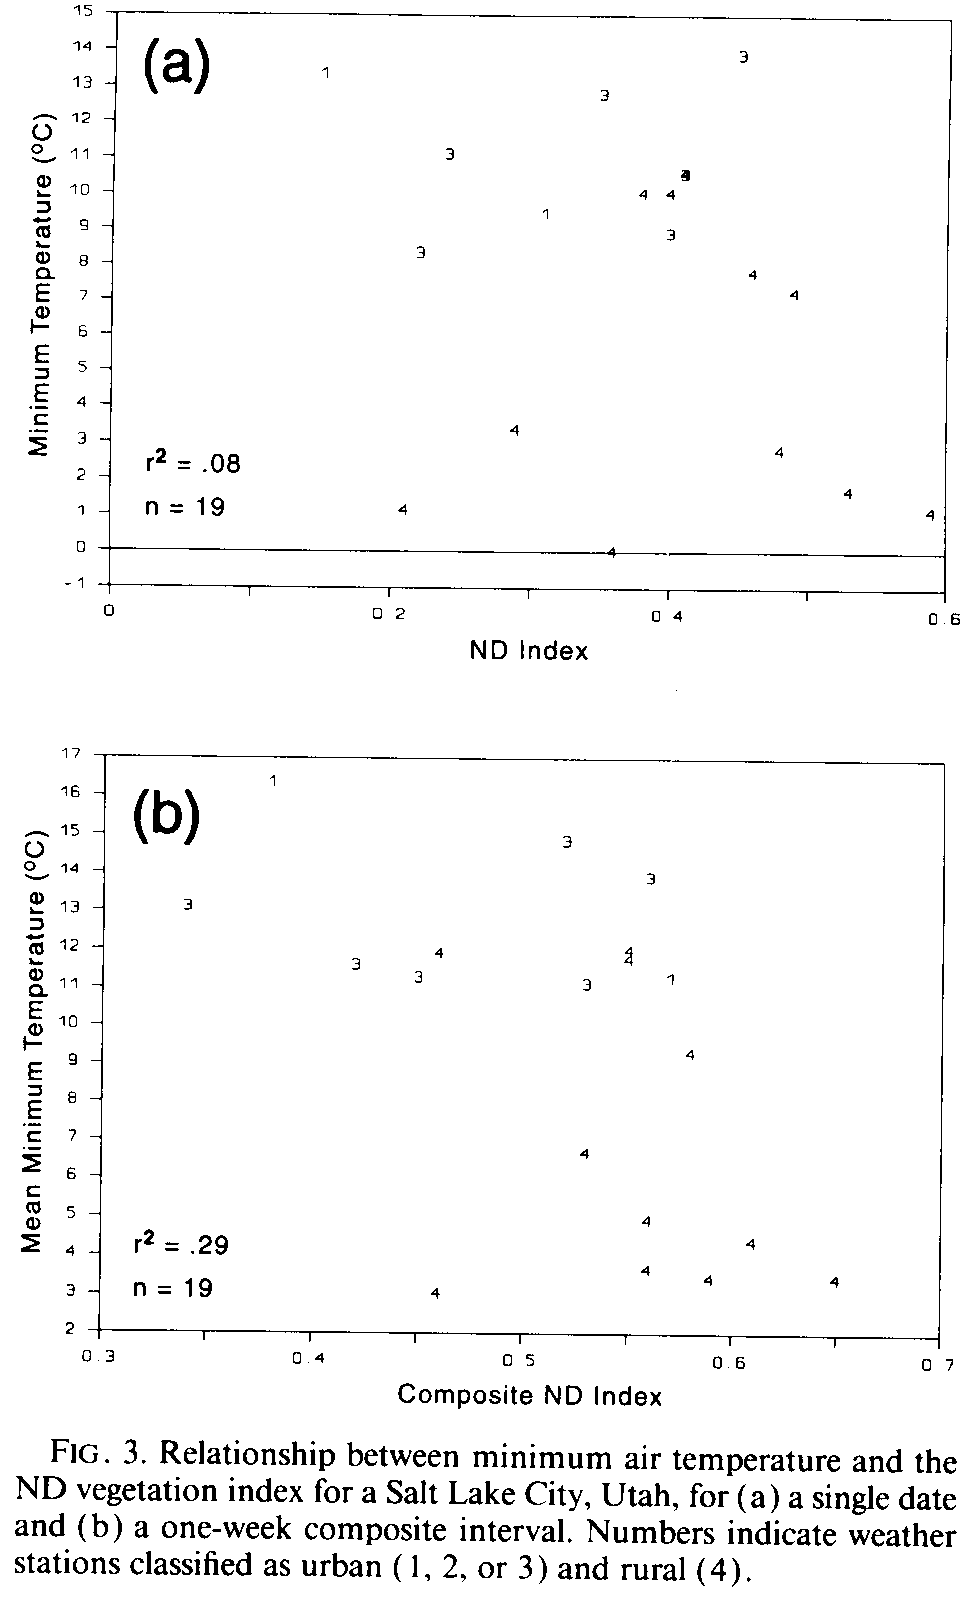
Closer examination of the data for selected cities revealed that elevation differences between the weather stations appeared to limit the improvement in the relationships, even with use of composite data. The use of composite ND data for Seattle, Washington, (Fig. 2) explained 77% of the variation in mean Tmin (28 June-4 July), while data of a single date (1 July) were associated with only 53% of the variation in Tmin. Single-date ND data for Salt Lake City, Utah, (1 July, Fig. 3) were associated with 8% of the variation in Tmin, while the composite data (28 June-4 July) were associated with 29% of the variation in mean Tmin. Elevation of weather stations utilized for Salt Lake City ranged from 1287 to 2664 m, while those of Seattle varied from 6 to 475 m. Subsequent analyses included a subset of the cities where the difference between the lowest and highest station elevations was less than 500 m. Those urban areas excluded from the subset of data included ABQE, BOSE, CSPR, FLSF, LVGS, TCSN, SCTO, SDGO, and SLKC (Table 1).
Generally, composite ND or Tsfc data were associated with a greater percent of the variation in Tmin than were data from single dates. This result was not unexpected as the UHI development varies with day-today meteorological conditions. The establishment of a UHI and the greatest differences between urban and rural conditions are observed under clear and calm conditions, while the differences dissipate when cloudy and windy conditions are present (Landsberg 1981 ).
b. Temporal consistency of weekly, biweekly, and monthly urban-rural differences
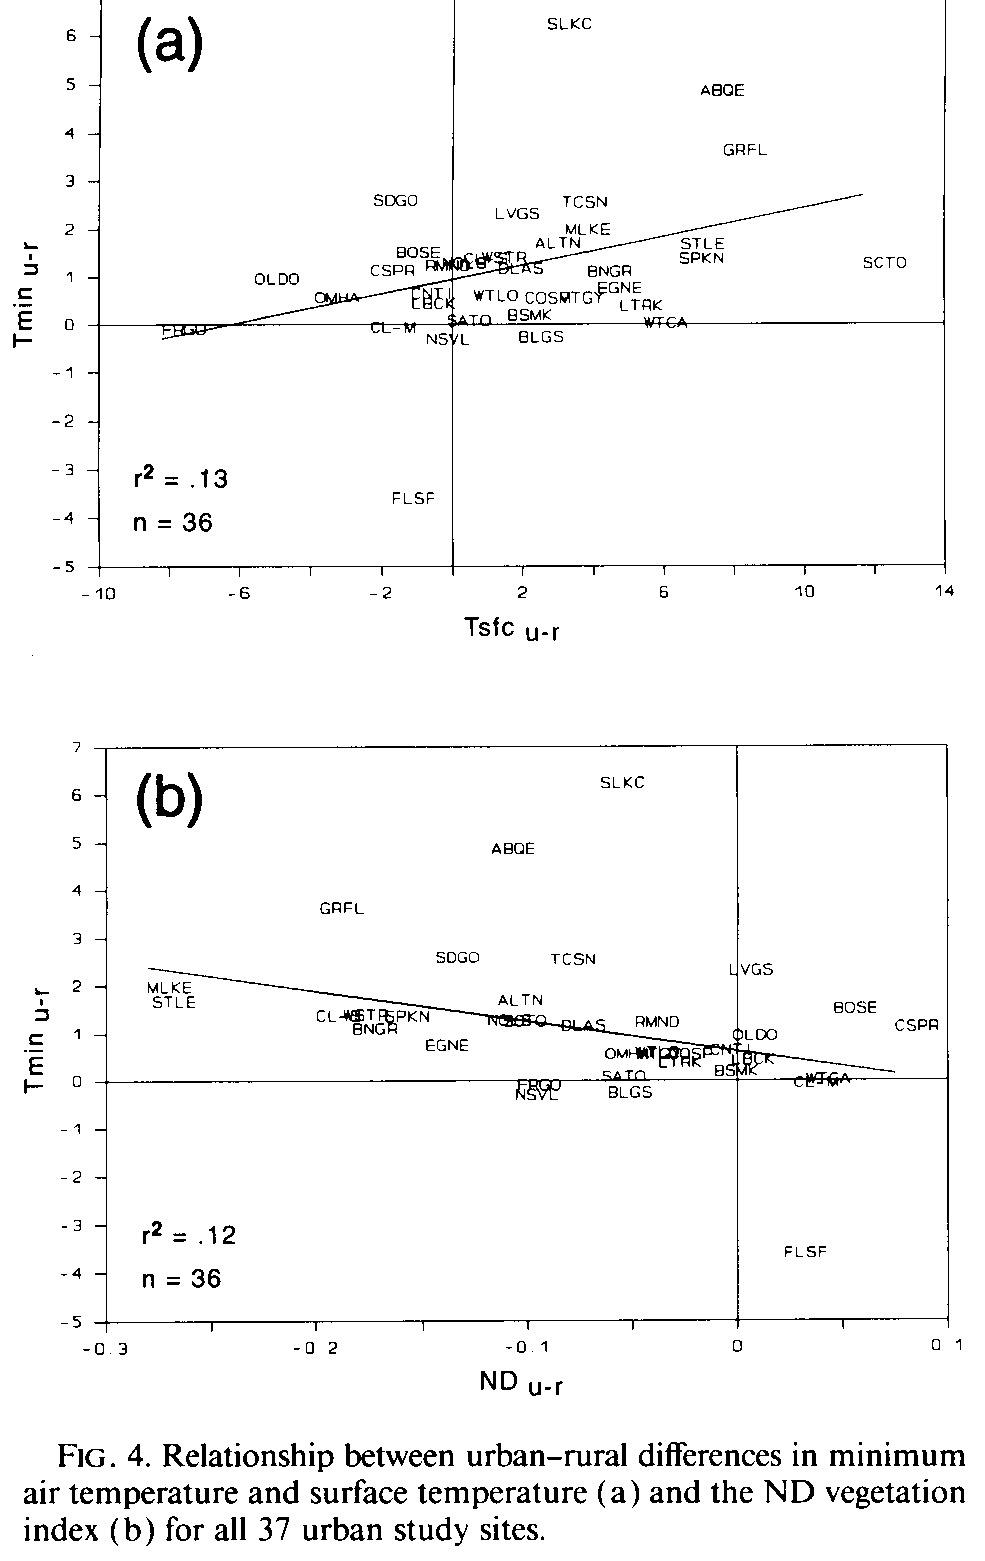
Urban-rural differences in Tmin (Tmin) were computed for the weekly composite interval of 28 June-4 July and compared to urban-rural differences in ND (NDUu-r) and Tsfc (Tsfcu-r) observed during the same interval. The urban-rural differences were similar to previously observed results (Carlson et al. 1977; Matson et al. 1978; Kidder and Wu 1987), as the Tsfc sampled over urban areas was greater than that observed for Tsfc sampled from rural regions. Generally, those cities with the greatest difference in Tsfc between the urban and rural environments also exhibited the greatest difference in minimum temperatures (Fig. 4a).
An inverse relationship, as indicated by a negative slope, existed between urban-rural differences in minimum temperature and the ND vegetation index (Fig. 4b). Generally those cities with greatest negative differences in ND values between the urban and rural environments (i.e., ND values greater in rural compared to urban sample locations) displayed the greatest positive difference in minimum temperature (Fig. 4b). This result indicates that those cities with the greatest contrast in green vegetation between urban and rural environments exhibit the greatest contrast in minimum temperatures between the two environments. This result is consistent with the theory (Carlson et al. 1981) that the amount of heat stored by vegetated areas (primarily located in rural environments) compared to nonvegetated areas (primarily the urban environment) is a major factor that contributes to the observed UHI effect.
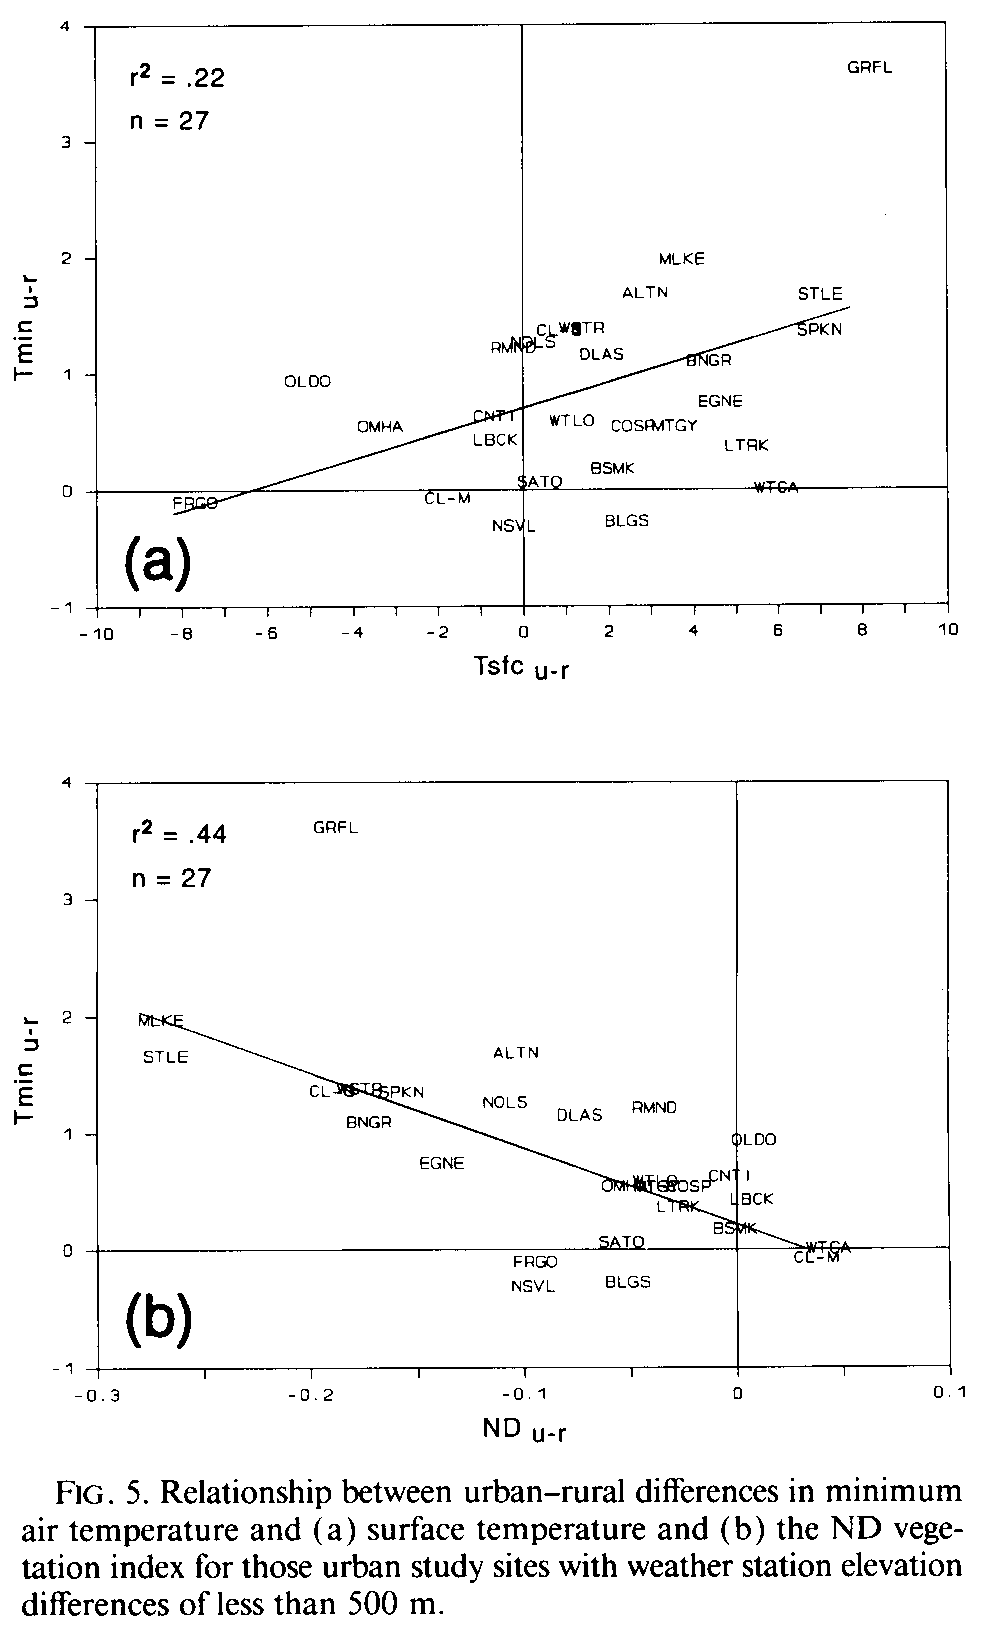
When only those cities with weather stations that exhibited less than 500-m elevation differences were examined, the amount of variation in Tmin explained by Tsfcu-r and NDu-r increased to 22% and 44%, respectively (Figs. 5a and 5b).
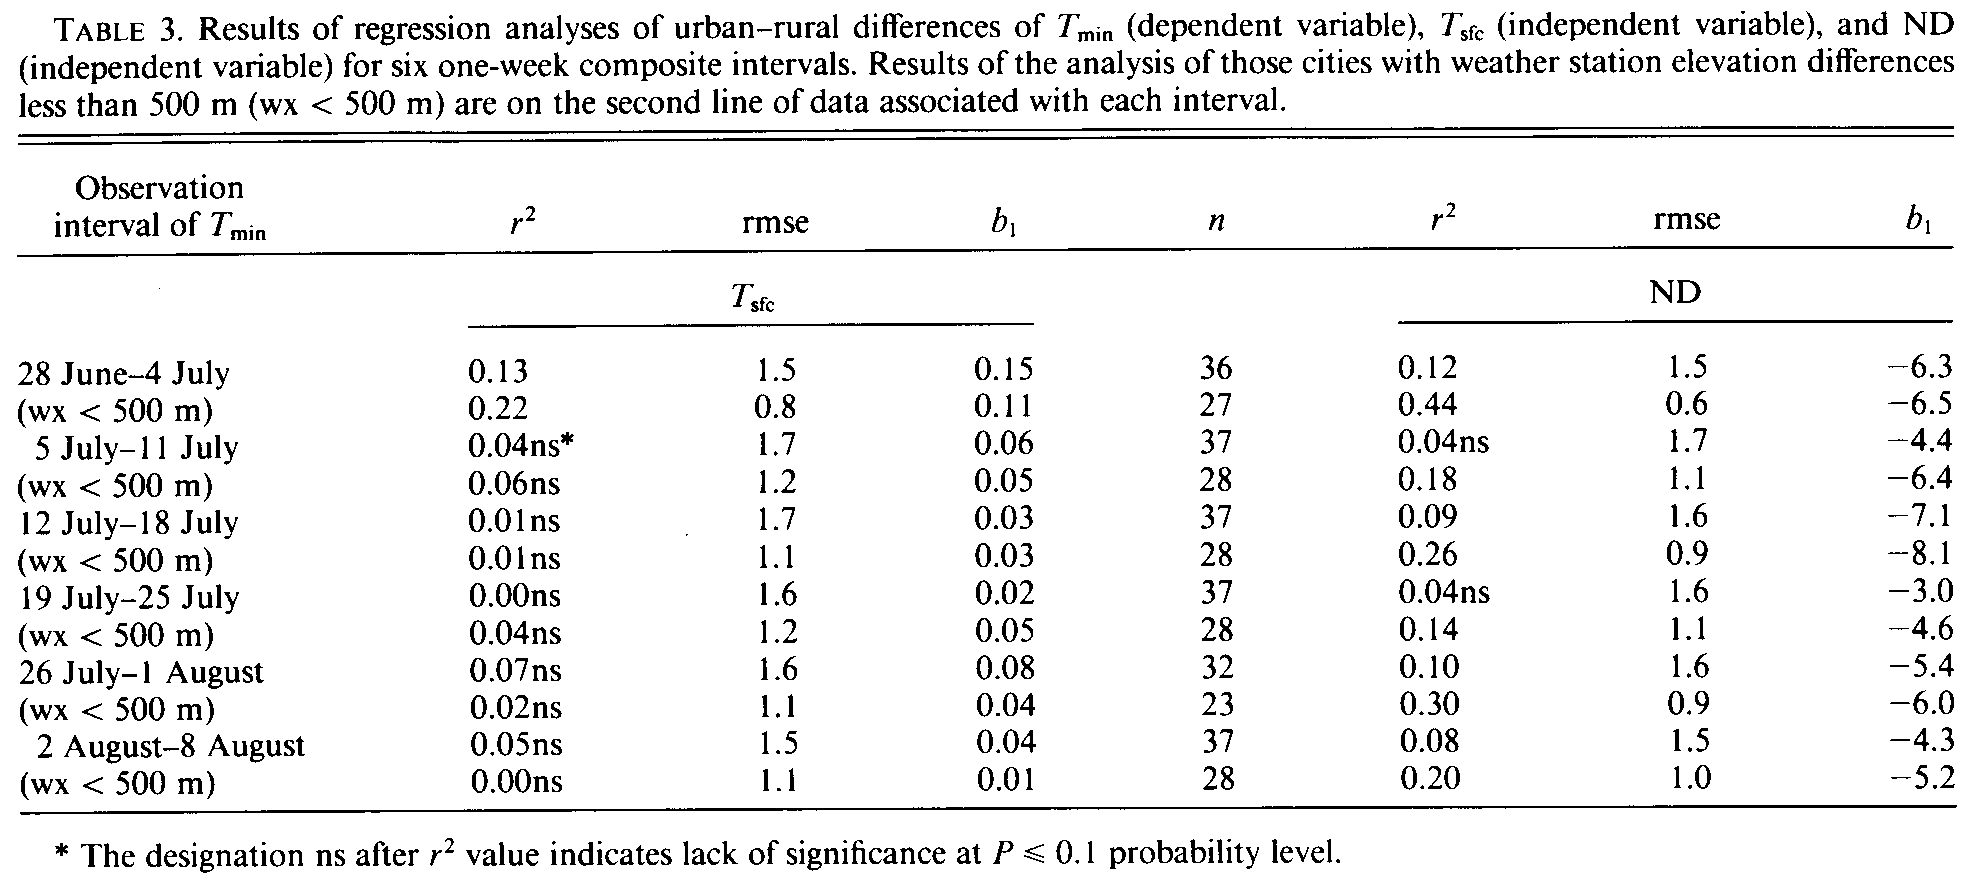
Table 3 presents the results of the linear regression analyses of urban-rural differences in Tmin, Tsfc, and the ND index for the six weekly composite intervals examined. The first weekly composite interval (28 June-4 July) was the only one that exhibited a statistically significant (P <= 0.1 ) relationship between the urban-rural differences of Tmin and Tsfc. The analyses of the subset of cities with weather station elevation differences less than 500 m (wx < 500 m) for subsequent weeks did not improve the significance of the relationships between Tminu-r and Tsfcu-r
The amount of variation of urban-rural differences in Tmin associated with variation in NDu-r was statistically significant (Table 3) for four of the six weeks examined when all cities (excluding those with cloud contamination) were included in the analyses. The amount of variation in Tminu-r associated with variation in NDu-r increased and was statistically significant for all six weeks when the analyses included only the wx < 500 m cities.
The amount of variation in Tminu-r associated with variation in NDu-r ranged from 14% (composite interval 19-25 July) to greater than 40% (28 June-4 July) for the wx < 500 m cities. The slope b1 of the relationship of Tmin and NDu-r indicates the change in Tmin (deg.C) between urban and rural regions per unit difference in ND between urban and rural samples. The slopes ranged from -4.6 to -8.1 for the analyses of the wx < 500 m cities. These values indicate that for an NDu-r value of -0.1, a Tmin of 0.46deg.-0.81deg.C could be expected between the urban and rural environments. All of the b1 values for the wx < 500 m ND data were statistically significant (P <= 0.1).
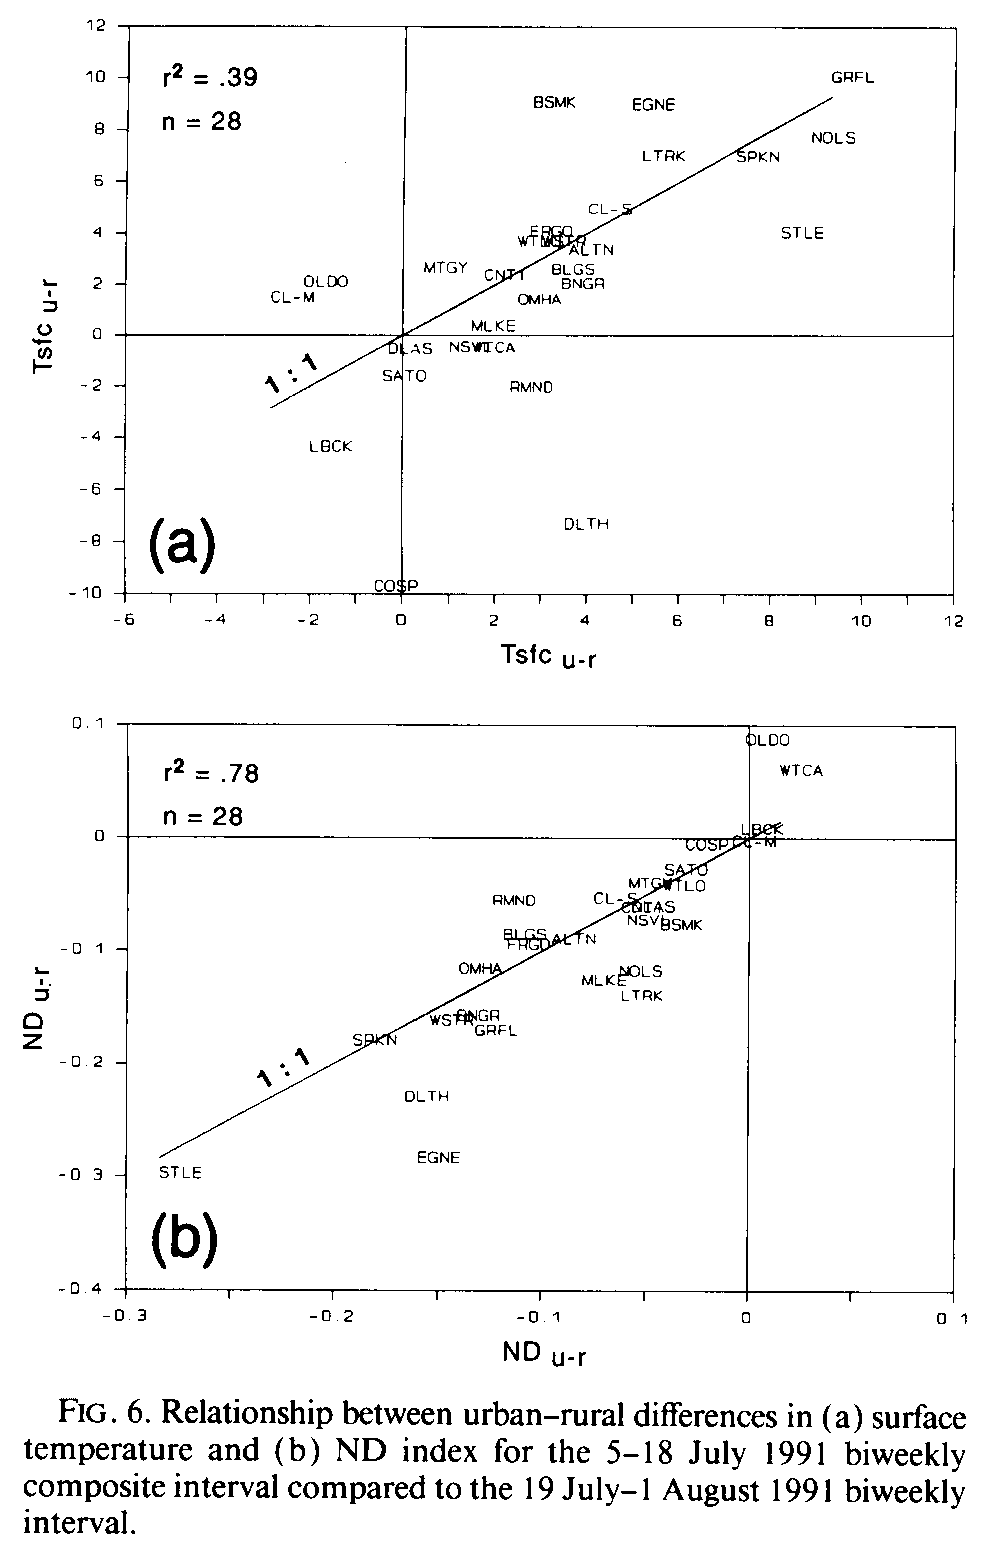
Similar analyses of Tminu-r, Tsfcu-r, and NDu-r were conducted for two biweekly intervals that coincided with biweekly intervals of the conterminous United States AVHRR product of the USGS EROS Data Center (USGS 1991 b). The data of two weekly composites (5- 11 July and 12- 18 July 1991) were composited, based on the greatest ND values, to create a biweekly composite (5-18 July). A second biweekly composite, computed from two weekly composites, was processed for the 19 July-l August 1991 interval. Additionally, a monthly composite was created that spanned the 5 July-1 August 1991 interval.
The biweekly differences in urban and rural values of Tsfc and ND were examined prior to examination of their respective relationships with Tminu-r. The Tsfcu-r for the 5-18 July interval was associated with less than 40% of the variation observed in Tsfcu-r for the 19 July- 1 August interval (Fig. 6a). The NDu-r for the 5 July- 18 July interval was associated with greater than 75% of the variation observed in NDu-r for the 19 July-1 August interval (Fig. 6b). The temporal consistency was clearly greater for NDu-r compared to Tsfcu-r, over a four-week interval.
The analysis of the biweekly composite data for the interval 5-18 July (Table 4) indicates a significant (P <= 0.1 ) relationship between Tminu-r, and Tsfcu-r, for the wx < 500 m data. Neither of the individual weekly composites that compose this biweekly interval displayed a significant relationship between Tminu-r, and Tsfcu-r, (Table 3). The second biweekly interval examined (19 July-1 August), similar to the two weekly composites it included, did not display a significant relationship between Tminu-r, and Tsfcu-r, for either the entire dataset or the wx < 500 m subset of the data. The amount of variation in the monthly (5 July- 1 August) Tminu-r, associated with variation in Tsfcu-r, was significant, although less than 16% for the entire or wx < 500 m data (Table 4).
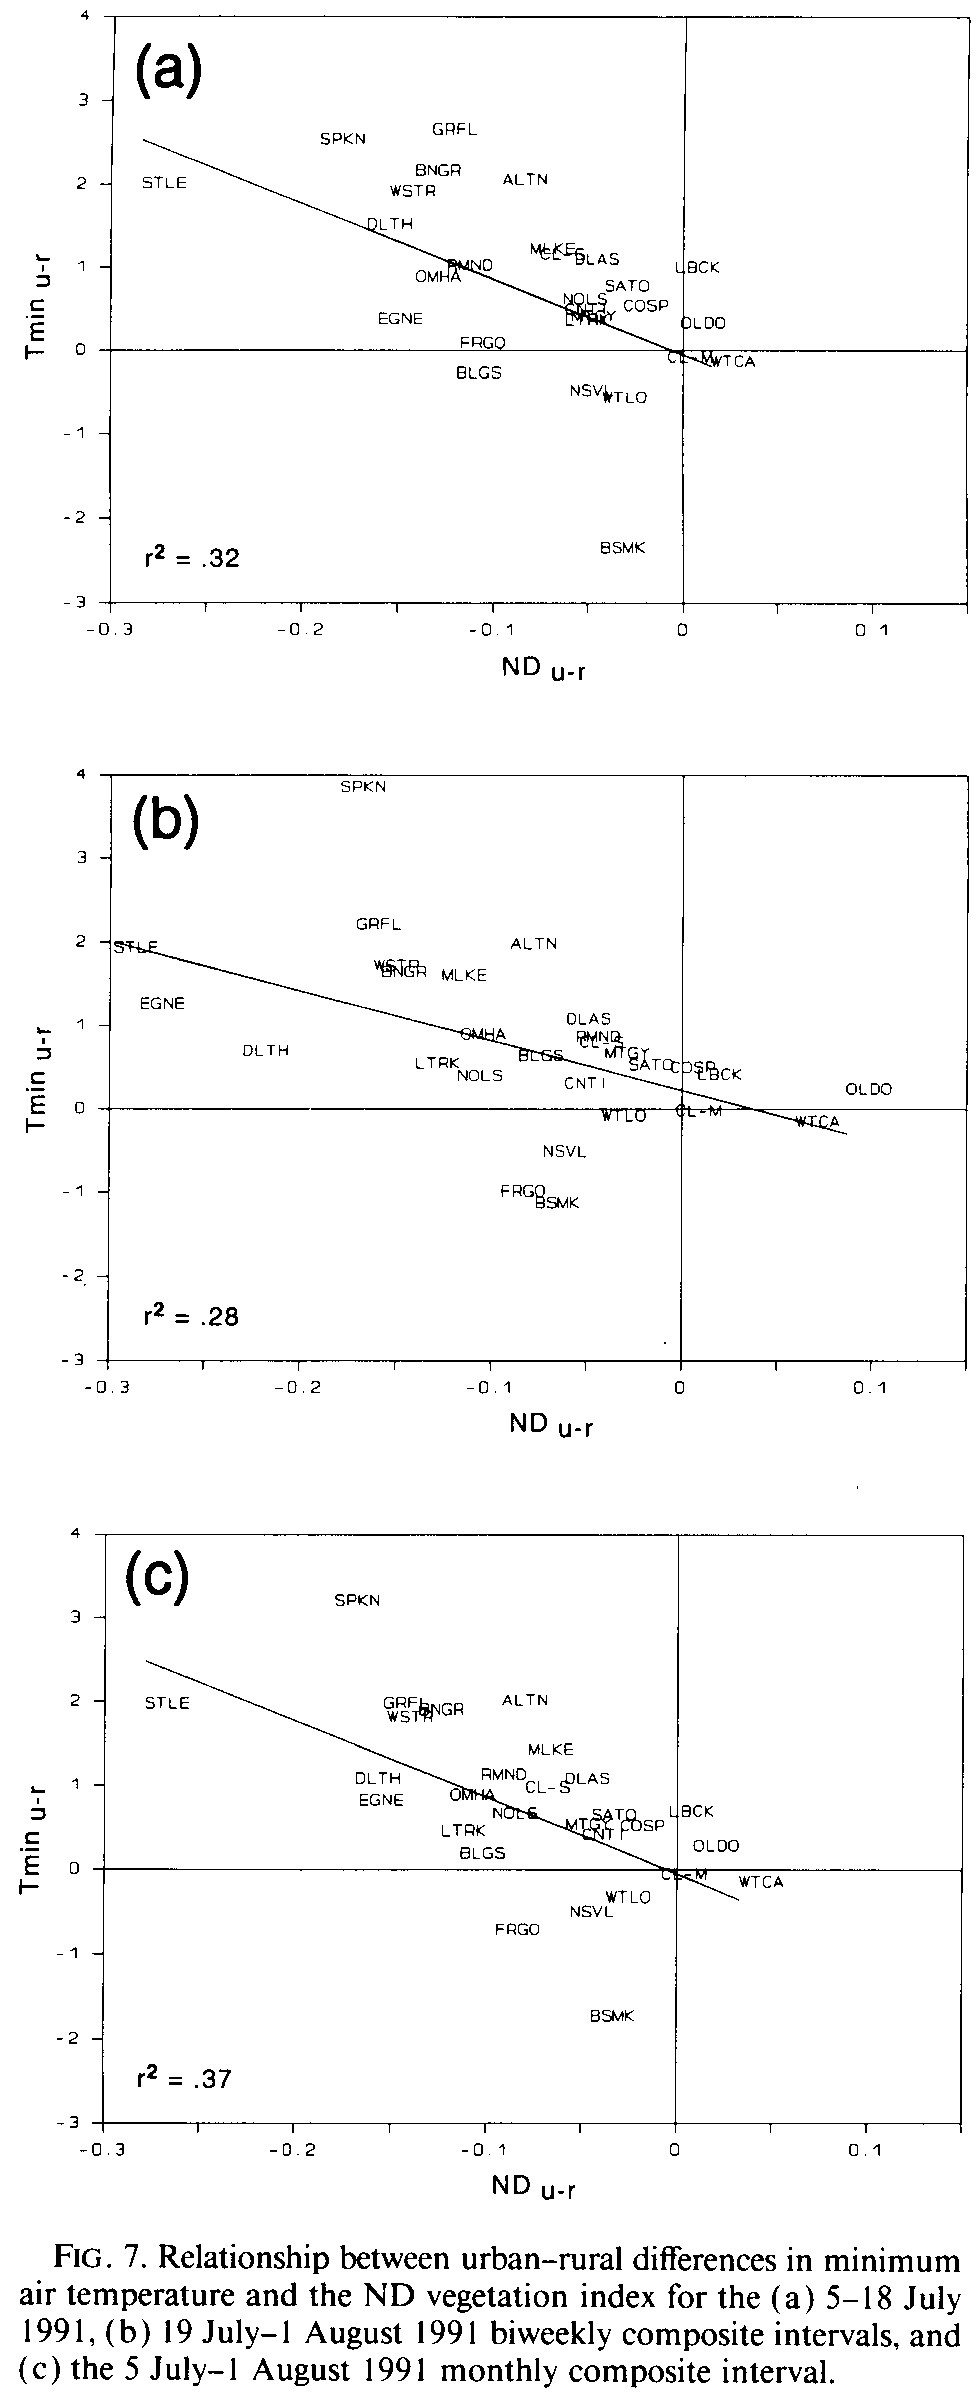
The amount of variation in Tminu-r, associated with variation in NDu-r was not statistically significant for the entire dataset of the 5-18 July biweekly interval; however, 32% of the variation was associated with variation in NDu-r for the wx < 500 m cities (Table 4, Fig. 7a). This amount (32%) was greater than that of either of the weekly intervals (r[2] = 0.18 and r[2] = 0.26, Table 3 ) that composed the biweekly data. The amount of variation in Tminu-r, associated with variation in NDu-r for the 19 July- 1 August biweekly composite of the wx < 500 m data (28%; Table 4, Fig. 7b) was slightly less than that of the weekly composite data for 26 July- 1 August (30%, Table 3 ).
The amount of variation in Tminu-r, associated with variation in NDu-r for the 5 July-1 August monthly composite of the wx < 500 m data (37%, Fig. 7c) was greater than that of the weekly or biweekly composites included in the interval. The rmse values for the biweekly and monthly composite intervals (wx < 500 m data, Table 4) were equal to or less than the values of any of the weekly composites (Table 3). This result, in addition to the generally greater amount of variation in Tminu-r associated with NDu-r computed from biweekly or monthly composites, suggests that at a minimum biweekly or monthly composites should be used to assess Tminu-r. Similar to the weekly composite analysis results (Table 3), the variation in Tmin associated with variation in NDu-r was greater than that of Tminu-r and Tsfcu-r for both the biweekly and monthly composites (Table 4).
The amount of variation in monthly Tmin associated with variation in NDu-r for the wx < 500 m cities (37% was greater than that associated with population (29%) as evaluated by Karl et al. (1988). The analyses of Karl et al. (1988) utilized urban and rural differences in Tmin for the summer months rather than a single month. The NDu-r analyses, however, indicate greater explanation of variance with increased time intervals. Thus, we might expect that an even greater explanation of variance in Tmin would occur as the length of the ND composite is increased. The analyses of this study were confined to a single season (summer), and analysis of other seasonal data is recommended.
The slope b1 of the relationships between Tmin and NDu-r of the wx < 500 m cities for the two biweekly composites and the monthly composite (Table 4) was greater than (more negative) or equal to those computed for their associated weekly intervals (Table 3). The urban-rural differences in Tmin and ND values were examined for each week, two weeks, and the monthly composite data to determine if the length of the composite interval systematically influenced these differences and the b1 values. The Tminu-r and NDu-r for the wx < 500 m cities were nearly constant and thus were not responsible for the observed increases in the b1 values. Although the intercept b0 values were not statistically significant for most weekly intervals (i.e., b0 = 0), the values did approach a value of zero with increased length of the composite interval and as the slope increased (Fig. 7). A physical explanation for this trend has not been identified.
One possible explanation for the relatively low amount of variation in Tminu-r associated with Tsfcu-r might be due to the process used to produce the weekly, biweekly, and monthly composites. The composites were based, as mentioned earlier, on maximum values of the ND index. Thus, the thermal data included in the weekly (biweekly or monthly) composites were from those individual dates (weeks) that exhibited the greatest value of the ND index. The relationship between Tminu-r and Tsfcu-r may be different if a composite based on the maximum Tsfc values, compared with maximum ND values, was utilized. Results of an analysis of the daily data of the 28 June-4 July interval indicate that a weekly composite based on ND, as used in this study, resulted in T4 (10.3-11.3 m) values that were 7deg.C less than when the composite was based on maximum values of T4 data. Continued analysis of the composite process, and the effect of the use of maximum ND on the other data included in the composite, is recommended.
In addition to the limitation of the application of this analysis to cities (urban and rural regions) with elevation changes less than 500 m, other limitations to its usefulness likely exist. The ND vegetation index would not be useful during the winter months in environments where the vegetation is no longer green and photosynthetically active. This analysis also may not be appropriate for those cities located in arid climates where vegetation primarily exists within the urban areas and is supported by irrigation. The analyses of the seasonal (spring and fall) urban-rural relationships are planned.
4. Conclusions
The satellite-derived normalized difference vegetation-index data, sampled over urban and rural regions composed of a variety of land surface environments, were linearly related to the differences in observed urban and rural minimum temperatures. Relationships between differences in the vegetation index and observed differences in temperature were improved when analyses were restricted by elevation differences between the sample locations within and around the urban areas. The relationship between urban and rural differences in observed minimum temperature and the vegetation index appears to be influenced by the length of time being examined. Based on the results, biweekly or monthly satellite composite and mean minimum temperature intervals are the recommended time periods for urban-rural analysis. The difference in the ND index between urban and rural regions appears to be an indicator of the difference in surface properties (evaporation and heat storage capacity) between the two environments that are responsible for differences in urban and rural minimum temperatures (the urban heat island effect). The urban and rural differences in the ND index explain a greater amount of the variance observed minimum temperature differences than past analyses that utilized urban population data. Through a judicious strategy for sampling urban and rural areas this analytic technique may provide a globally consistent method for assessment of the urban heat island effect.
Satellite-derived surface temperature data, sampled similarly to the vegetation-index data, were minimally related to observed differences in urban and rural minimum temperatures. This result may be due to the composite process used, and further investigation is recommended.
Acknowledgments. We are grateful for the assistance of D. McKittrick for classification of urban and rural weather stations, and that of P. Franks for climatic data extraction. This research was partially funded by the NASA Greenhouse Effect Detection Experiment (GEDEX) Grant IDP-88-069.
____________________
Corresponding author address: K. P. Gallo, Global Climate Laboratory, NOAA/NESDIS, National Climatic Data Center, Asheville NC 28801.
REFERENCES
Asrar, G., R. B. Myneni, and E. T. Kanemasu, 1989: Estimation of plant-canopy attributes from spectral reflectance measurements. Theory and Applications of Optical Remote Sensing, G. Asrar, Ed., J. Wiley & Sons, 734 pp.
Carlson, T. N., 1986: Regional-scale estimates of surface moisture availability and thermal inertia using remote thermal measurements. Remote Sens. Rev., 1, 197-247.
_____, J. A. Augustine, and F. E. Boland, 1977: Potential application of satellite temperature measurements in the analysis of land use over urban areas. Bull. Amer. Meteor. Soc., 58, 1301 - 1303.
_____, J. K. Dodd, S. G. Benjamin, and J. N. Cooper, 1981: Satellite estimation of the surface energy balance, moisture availability and thermal inertia. J Appl. Meteor., 20, 67-87.
Carnahan, W. H., and R. C. Larson, 1990: An analysis of urban heat sink. Remote Sens. Environ., 33, 65-71.
Changnon, S. A., 1992: Inadvertent weather modification in urban areas: Lessons for global climate change. Bull. Amer. Meteor. Soc., 73, 619-627.
Curran, P. J., J. L. Dungan, and H. L. Gholz, 1992: Seasonal LAI in slash pine estimated with Landsat TM. Remote Sens. Environ., 39, 3-13.
Daughtry, C. S. T., K. P. Gallo, S. N. Goward, S. D. Prince, and W. P. Kustas, 1992: Spectral estimates of absorbed radiation and phytomass production in corn and soybean canopies. Remote Sens. Environ., 39, 141-152.
EROS, 1990: Information Update: 1990 Conterminous U.S. AVHRR Biweekly Composites. Customer Services, USGS EROS Data Center, Sioux Falls, SD.
Gallo, K. P., and C. S. T. Daughtry, 1987: Differences in vegetation indices for simulated Landsat-5 MSS and TM, NOAA-9 AVHRR, and SPOT-I sensor systems. Remote Sens. Environ., 23, 439-452.
_____, and T. K. Flesch, 1989: Large area crop monitoring with the NOAA AVHRR: Estimating the silking stage of corn development. Remote Sens. Environ., 27, 73-80.
Goward, S. N., 1981: Thermal behavior of urban landscapes and the urban heat island. Phys. Geography, 2, 19-33.
_____, C. J. Tucker, and D. G. Dye, 1985: North American vegetation patterns observed with the NOAA-7 Advanced Very High Resolution Radiometer. Vegegation, 64, 3-14.
Holben, B. N., Y. J. Kaufman, and J. D. Kendall, 1990: NOAA-11 AVHRR visible and near-IR inflight calibration. Int. J. Remote Sens., 11, 1511-1520.
Karl, T. R., H. F. Diaz, and G. Kukla, 1988: Urbanization: Its detection and effect in the United States climate record. J. Climate, 1, 1099-1123.
Kidder, S. Q., and H. Wu, 1987: A multispectral study of the St. Louis area under snow-covered conditions using NOAA-7 AVHRR data. Remote Sens. Environ., 22, 159- 172.
Kukla, G., J . Gavin, and T. R. Karl, 1986: Urban warming. J. Climate and Appl. Meteor., 25, 1265-1270.
Landsberg, H. E., 1981: The Urban Climate. Academic Press, 275 PP
Lowry, W. P., 1977: Empirical estimation of urban effects on climate: A problem analysis. J. Appl. Meteor., 16, 129-135.
Matson, M., E. P. McClain, D. F. McGinnis, Jr., and J. A. Pritchard, 1978: Satellite detection of urban heat islands. Mon. Wea. Rev., 106, 1725- 1734.
Malingreau, J. P., 1986: Global vegetation dynamics: satellite observations over Asia. Int. J. Remote Sens., 7, 1121-1146.
Oke, T. R., 1973: City size and the urban heat island. Atmos. Environ., 7, 769-779.
_____, 1978: Boundary Layer Climates. Methuen & Co. Ltd., John Wiley and Sons, 372 pp.
_____, 1982: The energetic basis of the urban heat island. Quart. J Roy. Meteor. Soc., 108, 1-24.
Peterson, D. L., and S. W. Running, 1989: Applications in forest science and management. Theory and Applications of Optical Remote Sensing, G. Asrar, Ed., J. Wiley & Sons.
Price, J. C., 1979: Assessment of the urban heat island effect through the use of satellite data. Mon. Wea. Rev., 107, 1554-1557.
_____, 1990: Using spatial context in satellite data to infer regional scale evapotranspiration. IEEE Trans. Geosci. Remote Sens., 28, 940-948.
Quayle, R. G., D. R. Easterling, T. R. Karl, and P. Y. Hughes, 1991: Effects of recent thermometer changes in the cooperative station network. Bull. Amer Meteor. Soc., 72, 1718-1723.
Rand McNally, 1992: 1992 Commercial Atlas & Marketing Guide. Rand McNally, 567 pp.
Rao, P. K., 1972: Remote sensing of urban "heat islands" from an environmental satellite. Bull. Amer. Meteor. Soc., 53, 647-648.
Roth, M., T. R. Oke, and W. J. Emery, 1989: Satellite-derived urban heat islands from three coastal cities and the utilization of such data in urban climatology. Int. J. Remote Sens., 10, 1699-1720.
Running, S. W., R. R. Nemani, D. L. Peterson, L. E. Band, D. F. Potts, L. L. Pierce, and M. A. Spanner, 1989: Mapping regional forest evapotranspiration and photosynthesis by coupling satellite data with ecosystem simulation. Ecology, 70, 1090-1101.
USDC, 1991: State and Metropolitan Area Data Book 1991. U.S. Department of Commerce, Bureau of the Census, Superintendent of Documents, U.S. Government Printing Office, Washington, D.C., 388 pp.
USGS, 1991a: Hydrologic data sets. Conterminous U.S. AVHRR Companion Disc. (Compact Disc), USGS, National Mapping Division, EROS Data Center, Sioux Falls, SD.
_____, 1991b: The 1991 Conterminous U.S. AVHRR Biweekly Composites. (Compact Disc), USGS, National Mapping Division, EROS Data Center, Sioux Falls, SD.
Wiegand, C. L., A. H. Gerbermann, K. P. Gallo, B. L. Blad, and D. Dusek, 1990: Multisite analyses of spectral-biophysical data for corn. Remote Sens. Environ., 33, 1-16.