 Reproduced, with permission, from:
Smith, R. C., B. B. Prezelin, K. S. Baker, R R. Bidigare, N. P. Boucher, T. Coley, D. Karentz, S. MacIntyre, H. A. Matlick, D. Menzies, M. Ondrusek, Z. Wan, and K. J. Waters. 1992. Ozone depletion: Ultraviolet radiation and phytoplankton biology in Antarctic waters. Science 255: 952-59.
Reproduced, with permission, from:
Smith, R. C., B. B. Prezelin, K. S. Baker, R R. Bidigare, N. P. Boucher, T. Coley, D. Karentz, S. MacIntyre, H. A. Matlick, D. Menzies, M. Ondrusek, Z. Wan, and K. J. Waters. 1992. Ozone depletion: Ultraviolet radiation and phytoplankton biology in Antarctic waters. Science 255: 952-59.
The springtime stratospheric ozone (O3) layer over the Antarctic is thinning by as much as 50 percent, resulting in increased midultraviolet (UVB) radiation reaching the surface of the Southern Ocean. There is concern that phytoplankton communities confined to near-surface waters of the marginal ice zone will be harmed by increased UVB irradiance penetrating the ocean surface, thereby altering the dynamics of Antaraic marine ecosystems. Results from a 6-week cruise (Icecolors) in the marginal ice zone of the Bellingshausen Sea in austral spring of 1990 indicated that as the O3 layer thinned: (i) sea surface and depth-dependent ratios of UVB irradiance (280 to 320 nanometers) to total irradiance (280 to 700 nanometers) increased and (ii) UVB inhibition of photosynthesis increased. These and other Icecolors findings suggest that O3-dependent shifts of in-water spectral irradiances alter the balance of spectrally dependent phytoplankton processes, including photoinhibition, photoreactivation, photoprotection, and photosynthesis. A minimum 6 to 12 percent reduction in primary production associated with O3 depletion was estimated for the duration of the cruise.
HUMAN ACTIVITIES, INCLUDING THE PRODUCTION OF chlorofluorocarbons, have reduced the concentration of stratospheric O3 (1-3). The most dramatic loss of O3 has been observed over Antarctica during the austral spring, where a 50% reduction in O3--the widely discussed ozone hole--has been documented (4-7). Further reduction in average global stratospheric O3 at all latitudes is predicted over the next century despite international efforts to address the problem (8). Reduced stratospheric O3 results in increased flux of biologically damaging midultraviolet radiation (UVB, 280 to 320 nm) (9-12) to the surface of the earth and to ecologically significant depths in the ocean (13-17). Consequently, it has been hypothesized (16, 18-24) that marine life in the upper portion of the photic zone may be adversely affected by O3-dependent increases in UVB radiation. Experimental evidence shows that exposure to UVB radiation decreases algal productivity (19, 25-28) and causes damage to various forms of aquatic larvae and other organisms (29-37). Furthermore, evidence suggests that environmentally relevant levels of UVB radiation now incident at the surface of the ocean should negatively impact various natural populations of marine organisms (22, 33). In spite of the mounting evidence, the extrapolation of these findings to allow prediation of impacts on the dynamics and vitality of natural, mixed communities of marine organisms is uncertain (10, 11, 38-42), and estimated impacts to the Antarctic marine ecosystem have ranged from insignificant to catastrophic (43-45).
Phytoplankton blooms in the Antarctic marginal ice zone (MIZ) are believed to contribute significantly to the overall productivity of the Southern Ocean throughout the austral spring and summer (46-51). With rapidly increasing insolation in the spring, the ice melts, forming a highly stable, relatively fresh, upper mixed layer over saltier deeper water. The resulting strong vertical stratification concentrates and restricts algal blooms to the near-surface waters of the MIZ, and these blooms proceed southward as the ice edge recedes, whereas the seaward edge of the bloom is diluted by wind processes that lead to mixing at deep levels (47-56). This stability within the MIZ, while permitting the phytoplankton to remain in the upper layers where there is sunlight and nutrients, also potentially restricts the growing phytoplankton to depths where UVB has increased significantly in areas beneath the O3 hole. We carried out a 6-week cruise (Icecolors '90) in the MIZ of the Bellingshausen Sea (Fig. 1A) during a time of maximum O3 depletion in order to test whether Antarctic pelagic phytoplankton communities are adversely influenced by O3 depletion.
Atmospheric O3 is a strong selective absorber of ultraviolet (UV) radiation (57). The shortest and most damaging UV wavelengths, UVC (200 to 280 nm), are absorbed strongly by the atmosphere so that negligible amounts reach the earth's surface. UVB is also extremely injurious to organisms, and it is this radiation that increases most significantly when stratospheric O3 is reduced. The longest wavelengths of ultraviolet radiation (UVA, 320 to 400 nm) are known to induce both photodamage and photoreactivation processes in living cells (38, 58-60), and this radiation is relatively unaffected by variations in stratospheric O3 concentrations. Photosynthetically available radiation (PAR, 400 to 700 nm), like UVA, is nearly independent of O3 concentration. As a consequence, stratospheric O3 depletion leads to a dramatic increase in damaging UVB irradiance, QUVB, whereas the corresponding irradiance in the UVA, QUVA, and in the PAR, QPAR, remain relatively constant.
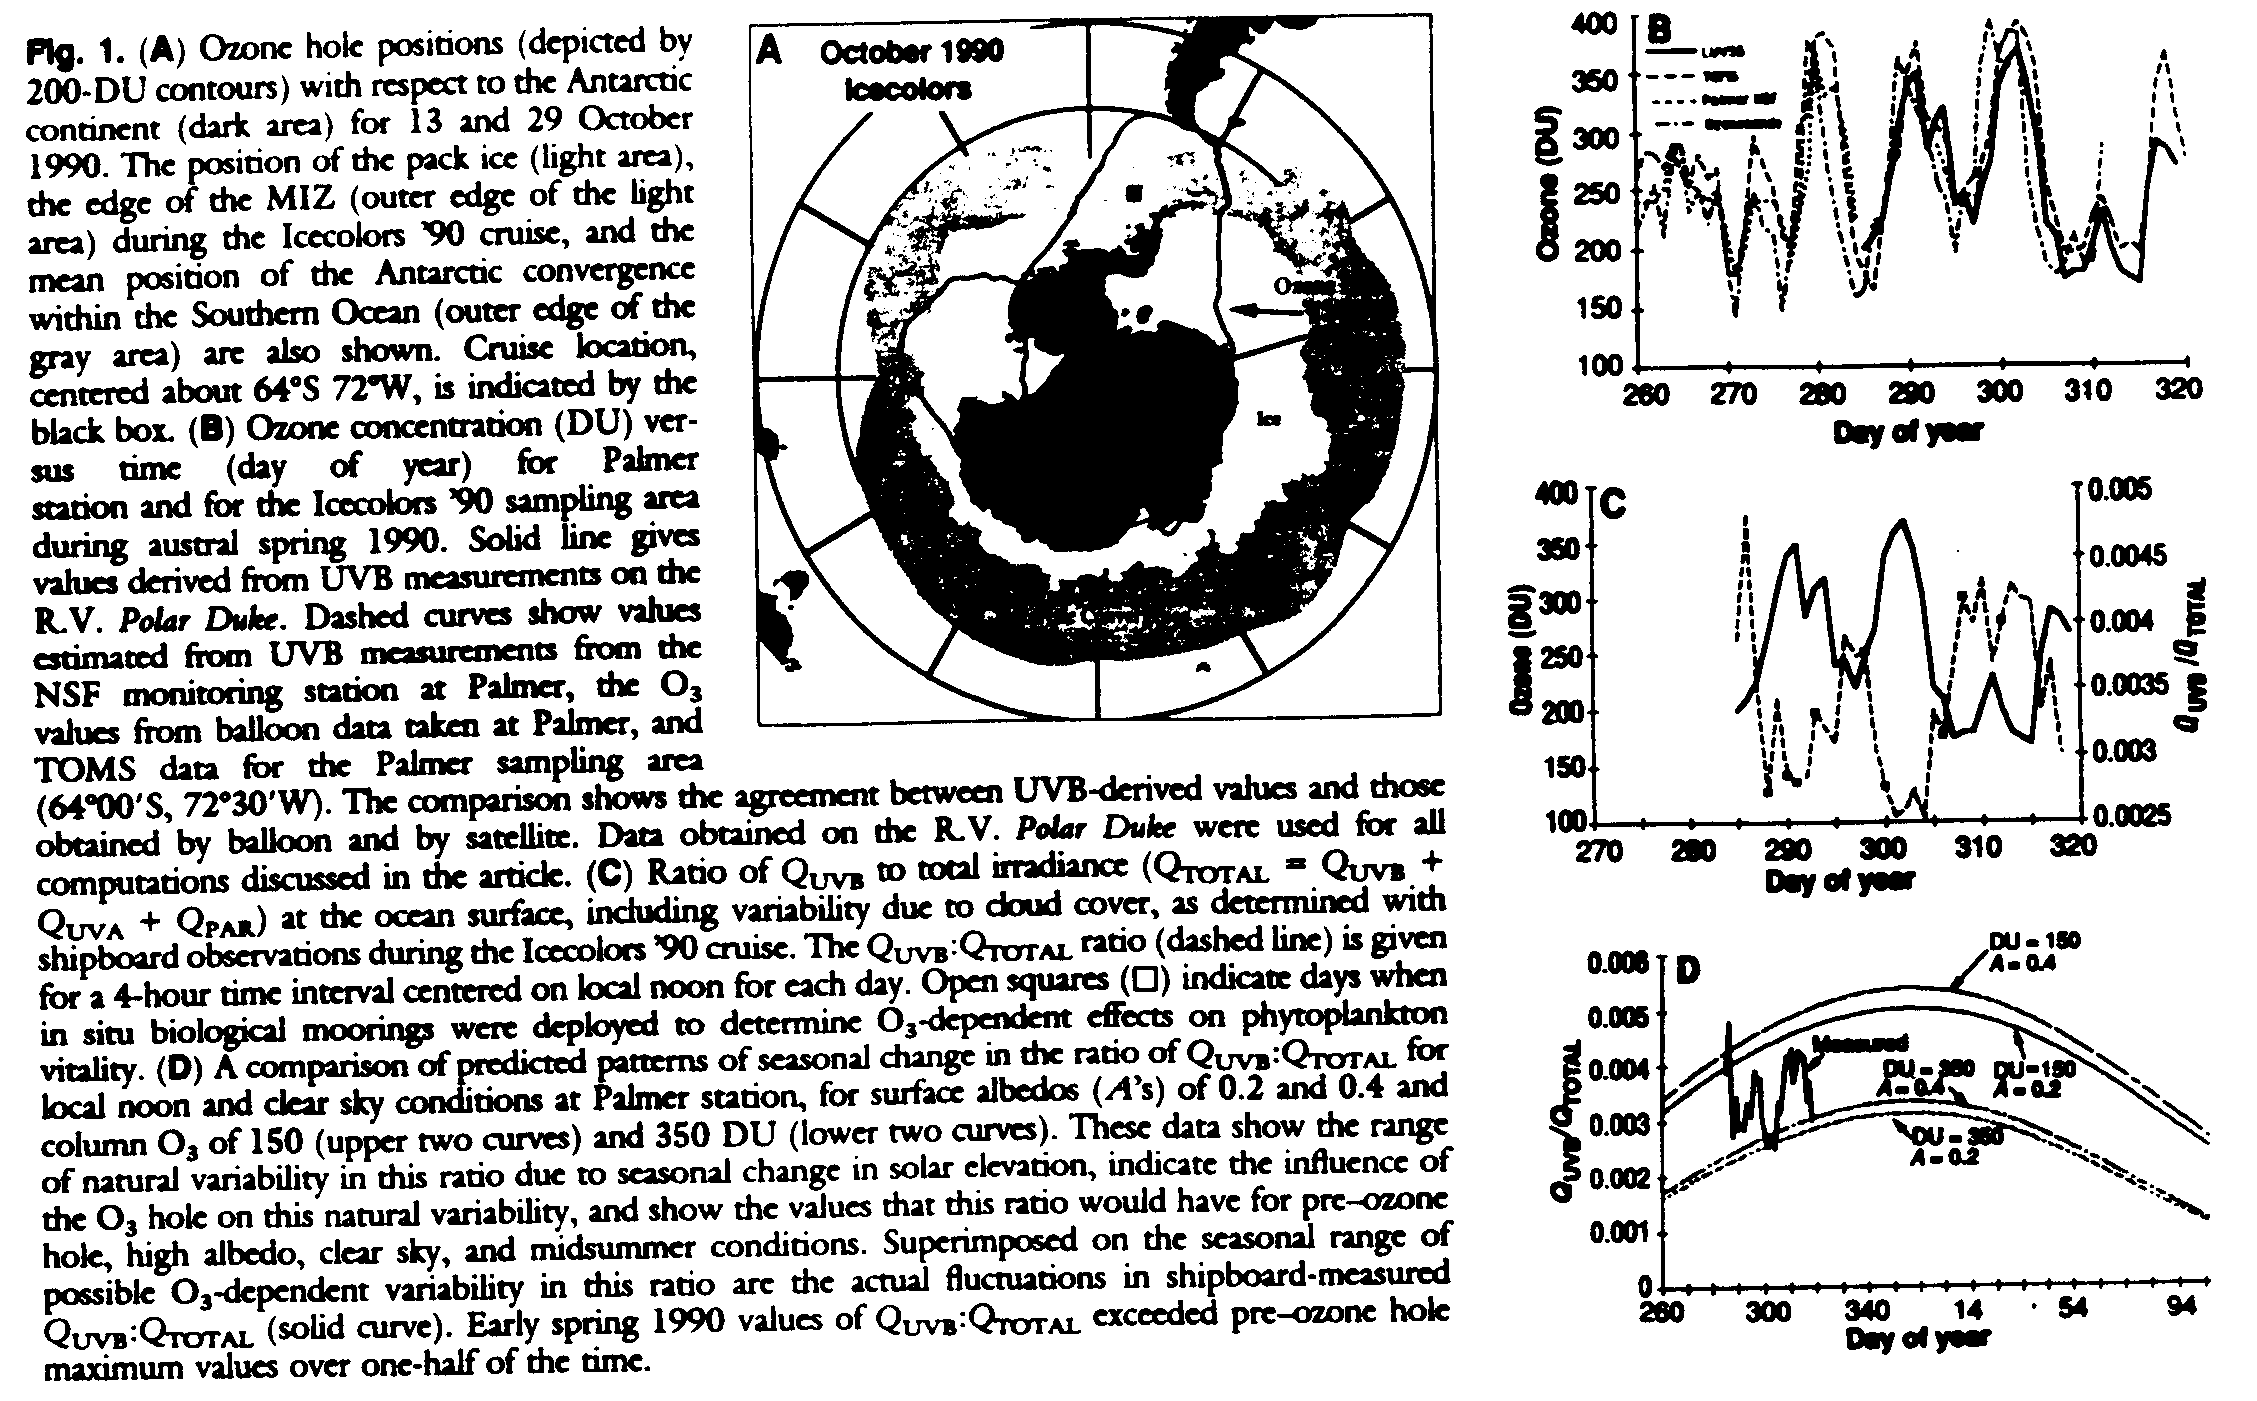
A knowledge of QUVB incident at the ocean surface and of the depth and magnitude of its penetration, as well as an estimate of the time spent by the phytoplankton at depth, is required to determine the irradiance or dose rate to which in situ phytoplankton communities are exposed to UVB radiation over different time and space scales (15, 28, 61-63). Such information is required for quantification of the damage to phytoplankton as a function of the magnitude and duration of O3-dependent UVB exposure in underwater light fields. The biological weighting function for phytoplankton damage is poorly understood and is the subject of active research. We designed our experiment to measure the differential effects on phytoplankton inside and outside the area beneath the O3 hole, effects that we show are measurable in spite of our ignorance of an appropriate biological weighting function. We used a new in-water UV spectroradiometer to determine the penetration of UV radiation into Antarctic waters and a newly designed incubation system to quantify the impact of UVB radiation on phytoplankton pigmentation, photosynthetic physiology, growth processes, and overall rates of springtime primary productivity in the MIZ of the Bellingshausen Sea. The dynamics of the O3 hole (Fig. 1A) produce a sharp atmospheric gradient in O3, thus creating a QUVB front analogous to an oceanographic front in which the boundary is constantly repositioned by physical forcing functions (41, 42). The ratio of QUVB to total irradiance (QTOTAL) is significantly greater inside than outside the hole (Fig. 1, B, C, and D).
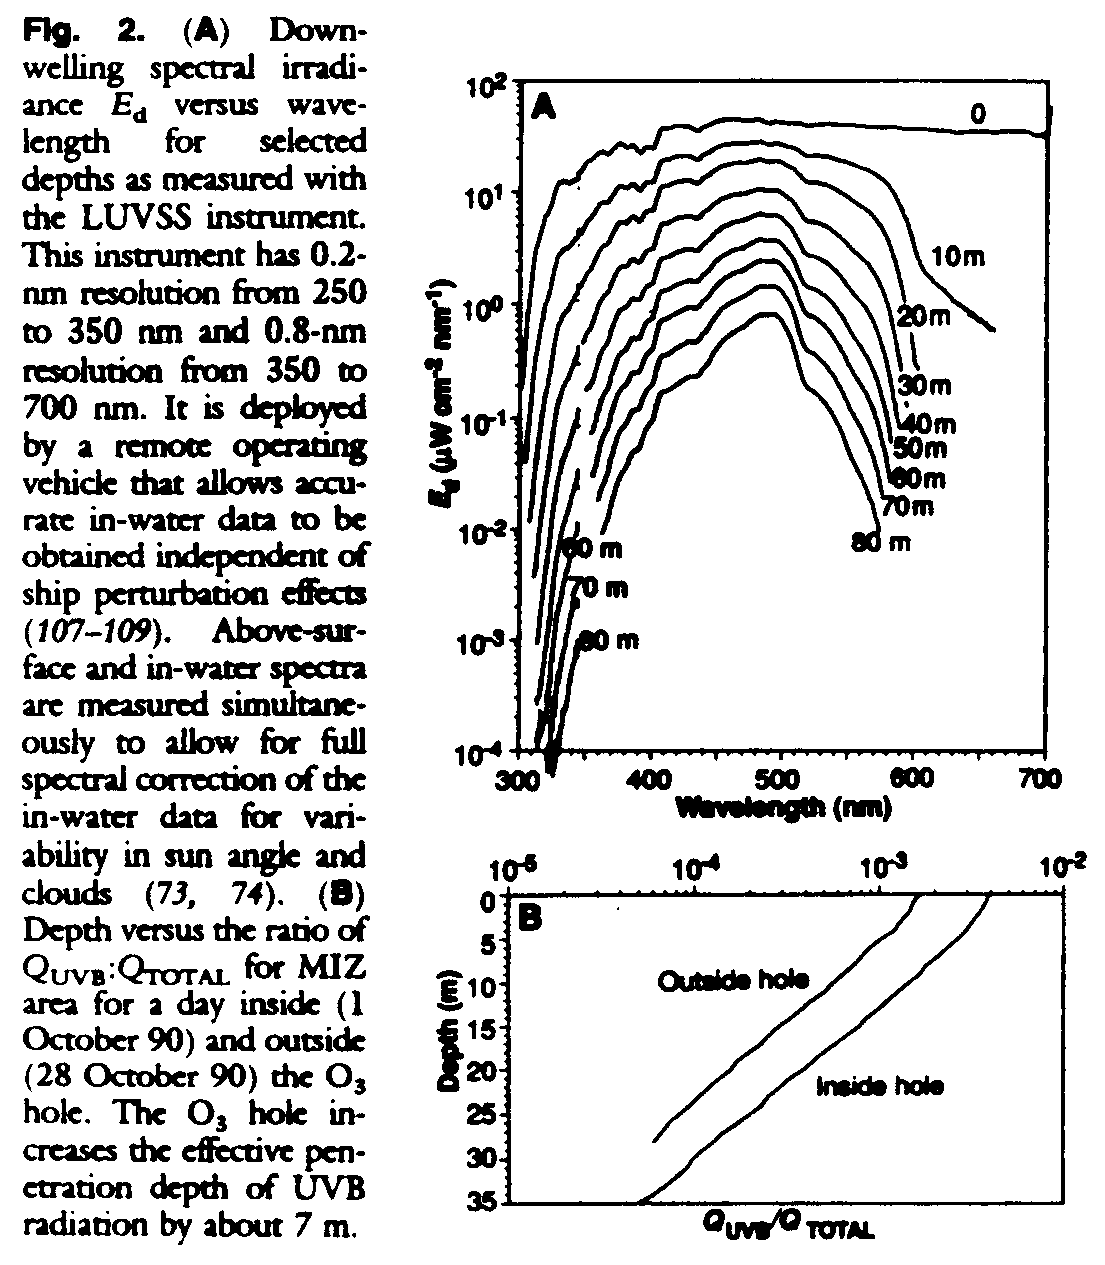
Our sampling strategy was designed to encompass a representative area of the MIZ in the Southern Ocean that would experience a significant variability in the concentrations of O3 above the ship's location (Fig. 1, A, B, and C). During a 6-week period (September to November 1990) we carried out four north-south (each 280 km) and three east-west (each ~72 km) transects of intensive vertical profiling (64-67) to define the physical, optical, chemical, and biological characteristics of the MIZ. At selected stations in the MIZ we made intensive observations to document the influence of increased UVB radiation on phytoplankton. In addition, we made a relatively long east-west transect from 80deg.W to 64deg.W within the MIZ (~860 km) to broaden the longitudinal extent of our observations. A new light and ultraviolet submersible spectroradiometer (LWSS), capable of measuring full spectral irradiance and underwater radiance to high resolution, was used to determine the penetration of UV as a function of depth and water type (Fig. 2).
Four replicate hydrographic and bio-optical transects perpendicular to the ice edge allowed us to identify and follow the area of maximum phytoplankton productivity in the MIZ. The ship was positioned in this area of the MIZ, and the impact of fluctuating O3 concentration on natural phytoplankton communities was quantified. Downwelling spectral irradiance (250 to 750 nm) incident at the ocean surface was monitored every minute at the ship's location. Recognizing that biologically effective solar radiation varies over several orders of magnitude with solar elevation, cloud cover, and depth, we often normalized spectral components to the total irradiance. This permits a quantitative comparison of O3-related changes in UVB over the wide range of natural variability in solar irradiance observed. From the full spectral data (for example, Fig. 2A), the ratio of QUVB to QTOTAL (QTOTAL = QUVB + QUVA + QPAR) was determined (Fig. 1, B and C), and total column O3 was estimated with a complete radiative transfer model of the atmosphere (68). The in-water measurements are consistent with previous work, and the O3 estimates compare well with Total Ozone Mapping System (TOMS) satellite estimates (69), Palmer balloon data (70), and surface data from the Palmer National Science Foundation Monitoring Station (71). During this 6-week period, O3 concentrations and the corresponding noontime QUVB:QTOTAL ratios varied by more than a factor of 2. As a consequence, phytoplankton experienced enhanced QUVB during most of the spring, modulated by the movement of the O3 hole. The springtime QUVB:QTOTAL ratio within the hole [~150 Dobson units (DU)] is larger than would ever exist, even at summer solstice, under normal (~350 DU) O3 concentrations (Fig. 1D) (72).
Full spectral irradiance, including the UVB region of the spectrum, was determined as a function of depth at the stations where detailed biological observations were carried out (Fig. 2A). The methods of Smith and Baker (73, 74) allow the spectral diffuse attenuation coefficient K(z, ), biological effective dose rates (15), and the ratio QUVB:QTOTAL to be estimated from these in-water data as a function of depth (z) and wavelength (
) (Fig. 2B) for comparison with biological observations. Whereas the QUVB:QTOTAL ratio is O3 dependent in the Southern Ocean, the vertical attenuation coefficients for spectral irradiance are nearly the same in and out of the O3 hole (Fig. 2B). Therefore, if QUVB is doubled at the surface, it will be doubled at all depths, and the critical depth for UVB damage effects will be deeper in the water column. We found that UV penetrates to ecologically significant depths, a result consistent with earlier work (17). The new LUVSS was sufficiently sensitive to detect UVB radiation at depths in excess of 60 to 70 m, well below depths where we noted biological effects on rates of primary production.
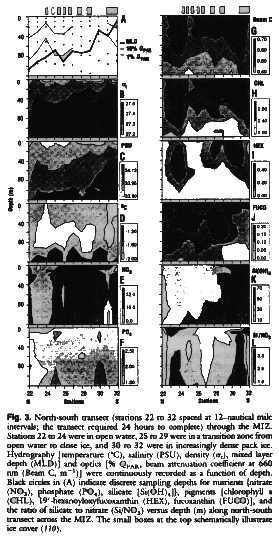
A major feature of the MIZ is the presence of ice, which, through freeze-thaw cycles that change the surface layer's salinity and hence density, is an important factor in establishing the stability of the upper water column. Figure 3 shows the hydrography, optical properties, and nutrient and pigment distributions for our second north-south transect through the MIZ The data show that mesoscale variations occurred over time scales of days. During springtime, meltwater creates density gradients that promote water column stability and subsequent phytoplankton growth (75). The contours of salinity and density (t) show that the mixed-layer depth (MLD) generally increased with distance from the pack ice and was influenced primarily by an increasingly thick lens of fresher water and greater wind mixing away from the pack ice (Fig. 3, A through C). The MIZ is dynamic and can change rapidly in response to physical forcing events, including diurnal variability of solar iosolation, leading to increased stratification during daylight followed by convective overturning at night. We infer from these and other data that the depth of surface mixing progressively shallowed near the edge of the pack ice and that reflectively stable water columns characterized stations where phytoplankton biomass was elevated. Finer scale temperature profiles and corresponding profiles of ot (not shown) often indicated near-surface inversions and provided estimates of centimeter- to meter-scale vertical movement occurring on time scales of minutes to hours within the stabily stratified water near the pack ice.
Inorganic nutrient concentrations (Fig. 3, E, F, and K) were high, and phytoplankton growth was presumably limited by light, not nutrient, availability (76). However, nutrient concentrations were variable, suggesting that some physical mixing was occurring (stations 26 and 27) and that plants were using nutrients for growth (stations 23, 24, 30, and 31). The quantity chlorophyll a, a measure of phytoplankton biomass, was highest near the edge of the pack ice and at station 24 (Fig. 3H). The beam attenuation coefficient (Fig. 3G) is a measure of suspended parciculate matter and was highly correlated with chlorophyll a distributions, suggesting that the suspended particles sampled in our study region were dominated by living phytoplankton. The prymnesiophyre Phaeocystis spp. dominated most phytoplankton communities, as has been observed on occasion for these Antarctic waters (77-79), and cell densities ranged from 1000 to 4000 cells per milliliter. The remainder of the phytoplankton communities consisted mostly of diatoms (30 to 400 cells per milliliter). An excellent correspondence (data not shown) was observed between microscopically enumerated phytoplankton counts (Phaeocystis spp. and diatoms) and distributions of their respective diagnostic pigments 19'-hexanoyloxyfucoxanthin (Fig. 3I) and fucoxanthin (Fig. 3J). Very low concentrations of dinoflagellates (less than one cell per milliliter) were observed in plankton samples. The low and variable concentrations of chlorophyll b and alloxanthin measured along the transect line revealed that green algae and cryptophytes were only minor phytoplankton biomass components (data not shown).
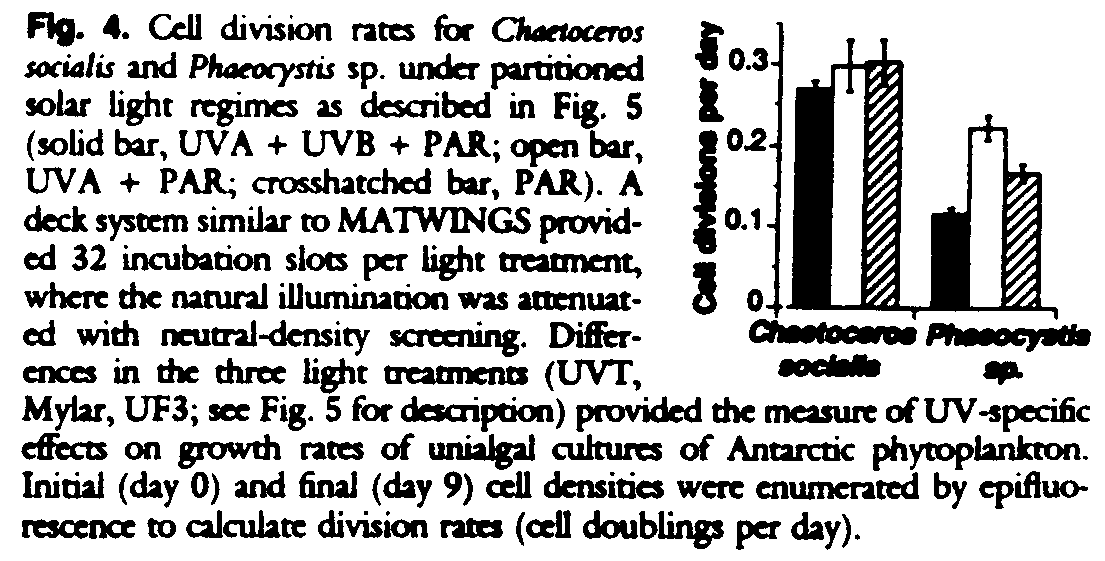
Phytoplankton have a number of photoreactivation and photoprotective strategies to partially compensate for photoinhibitory effects of different wavelengths of light (80-82). During Icecolors '90, we attempted to elucidate these strategies by determining (i) the impact of UV radiation on the growth potential of two isolated clones of Antarctic phytoplankton; (ii) the potential lethality of UVB radiation on unprotected microbes; (iii) the presence of UV photoprotectants in the water column; and (iv) the distribution of UVA+PAR-photoprotective carotenoids in MIZ phytoplankton communities. The results of the first study (Fig. 4) indicated that the UVB inhibition of growth rate was much greater for a Phaeocystis spp. than for a clone of the diatom Chaetoceros socialis. Results indicate the vulnerability of Phaeocystis to decreasing stratospheric O3 levels and demonstrate the species-specific nature of UVB inhibition that has been already demonstrated for laboratory cultures of Antarctic diatoms (83, 84). In the second study sealed samples of a test bacterium with no means of DNA repair were incubated on the in situ productivity moorings and showed a lethality due to DNA damage that was directly related to O3-dependent increases in QUVB. These results are similar to those reported for the 1988 Antarctic O3 depletion (85). Analysis of our data suggests an ~3% loss of growing cells at 350 DU compared with an estimated 25% loss at 200 DU. These dosimeter results represent an estimated upper limit for biologial damage caused by UVB within the water column. Endemic microorganisms might use photoprotective strategies to mitigate UV effects to some extent. In our pigment studies, we documented an enhanced concentration of plant photoprotective carotnoids (diadinoxanthin diatoxanthin and ß-carotene) in surface waters of the MIZ and the presence of at least four different UV-absorbing mycosporine-like amino acids (MAAs) was tentatively identified in filtered particle samples (86). MAAs have been detected in macroalgae phytoplankton and invertebrates (87-90) they absorb strongly between 270 and 350 nm and cellular concentrations typically accumulate under high light conditions (88, 91, 92); thus it is surmised that they function as photoregulated UV blockers for marine algae and invertebrates.
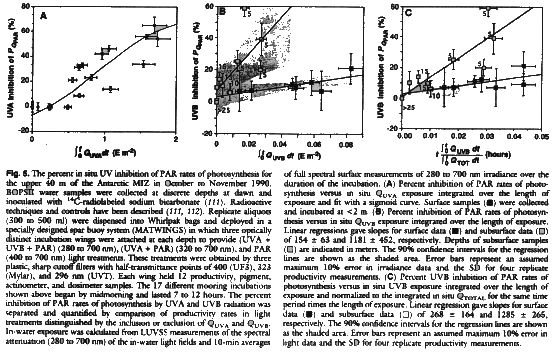
The stations where Phaeocystis spp. dominated (including station 30 of the north-south transect in Fig. 3) were selected for intensive biological sampling to test the influence of variable UV on the productivity of the most abundant phytoplankton communities of the MIZ. Primary productivity was shown to be inhibited by increased levels of both QUVB and QUVA, which we evaluated separately in order to assess specifically the influence of the O3 hole (Fig. 5). Our study was designed to measure the differential effects of UV radiation on phytoplankton inside and outside the O3 hole. We estimated the influence of UV radiation on in situ primary production by comparing three radiation treatments so that
PQTOT = PQPAR (1 - FIUVA - FIUVB) (1)
where PQPAR is the rate of primary production for plants exposed to PAR only (natural radiation filtered so as to pass only 400 to 700 nm), PQTOT is the rate of primary production for plants exposed to unfiltered radiation (PAR + QUVA + QUVB). and FIUVA and FIUVB represent the fractional inhibition of primary production attributable to QUVA and QUVB, respectively. The fractional inhibition due to UVA radiation was determined as a function of UVA exposure (QUVAt, t = time) (Fig. 5A), UVB exposure (QUVBt) (Fig. 5B) and UVB exposure normalized to QTOTAL (Fig. 5C). A fit to these data can be used to estimate FIUVA and FIUVB, which when inserted in Eq. 1 allows an estimation of PQTOT.
With our means of detection, O3-related UVB inhibition of photosynthesis was evident in samples incubated down to depths of 25 m (the 4% QPAR level) (Fig. 5, B and C). UVB inhibition was determined as the ratio of productivity under total irradiance (QTOTAL) to productivity with QUVB excluded. Results indicate that UVB inhibition of photosynthesis increases linearly (within the accuracy of measurement) with increasing UVB dose (Fig. 5B) and with O3-dependent increases in the ratio of QUVB:QTOTAL (Fig. 5C). As above, we used normalized spectral ratios so as to focus on O3-related, rather than sun angle- and cloud-related, variability. The rate constants for UVB inhibition differed for surface and subsurface phytoplankton communities. As the UVB dose and the ratio of (QUVBt):(QTOTAL) increased, surface samples displayed a residual 15 to 20% UVB inhibition of photosynthesis by the end of a 7- to 12-hour incubation, compared to 40 to 60% for samples from a depth of 5 m. Furthermore, transfer experiments (not shown), in which samples taken from depth were incubated at the surface and vice versa, showed that UVB inhibibon effects are independent of the sample depth and depend only on dose at the depth incubated. For instance, 5-m samples moved to surface conditions displayed UVB inhibition effects by the end of the day that were characteristic of surface samples and much lower than those of 5-m controls. When compared with results of shorter term experiments (not shown), the combined findings strongly suggest that (i) UVB inhibition of surface samples may be greatest during morning hours and mitigated by photoprotective mechanisms photoinduced during the day; and (ii) UVA photoregulabon of UVB photoprotective mechanisms may largely control the pattern of UVB inhibition of primary production in the MIZ.
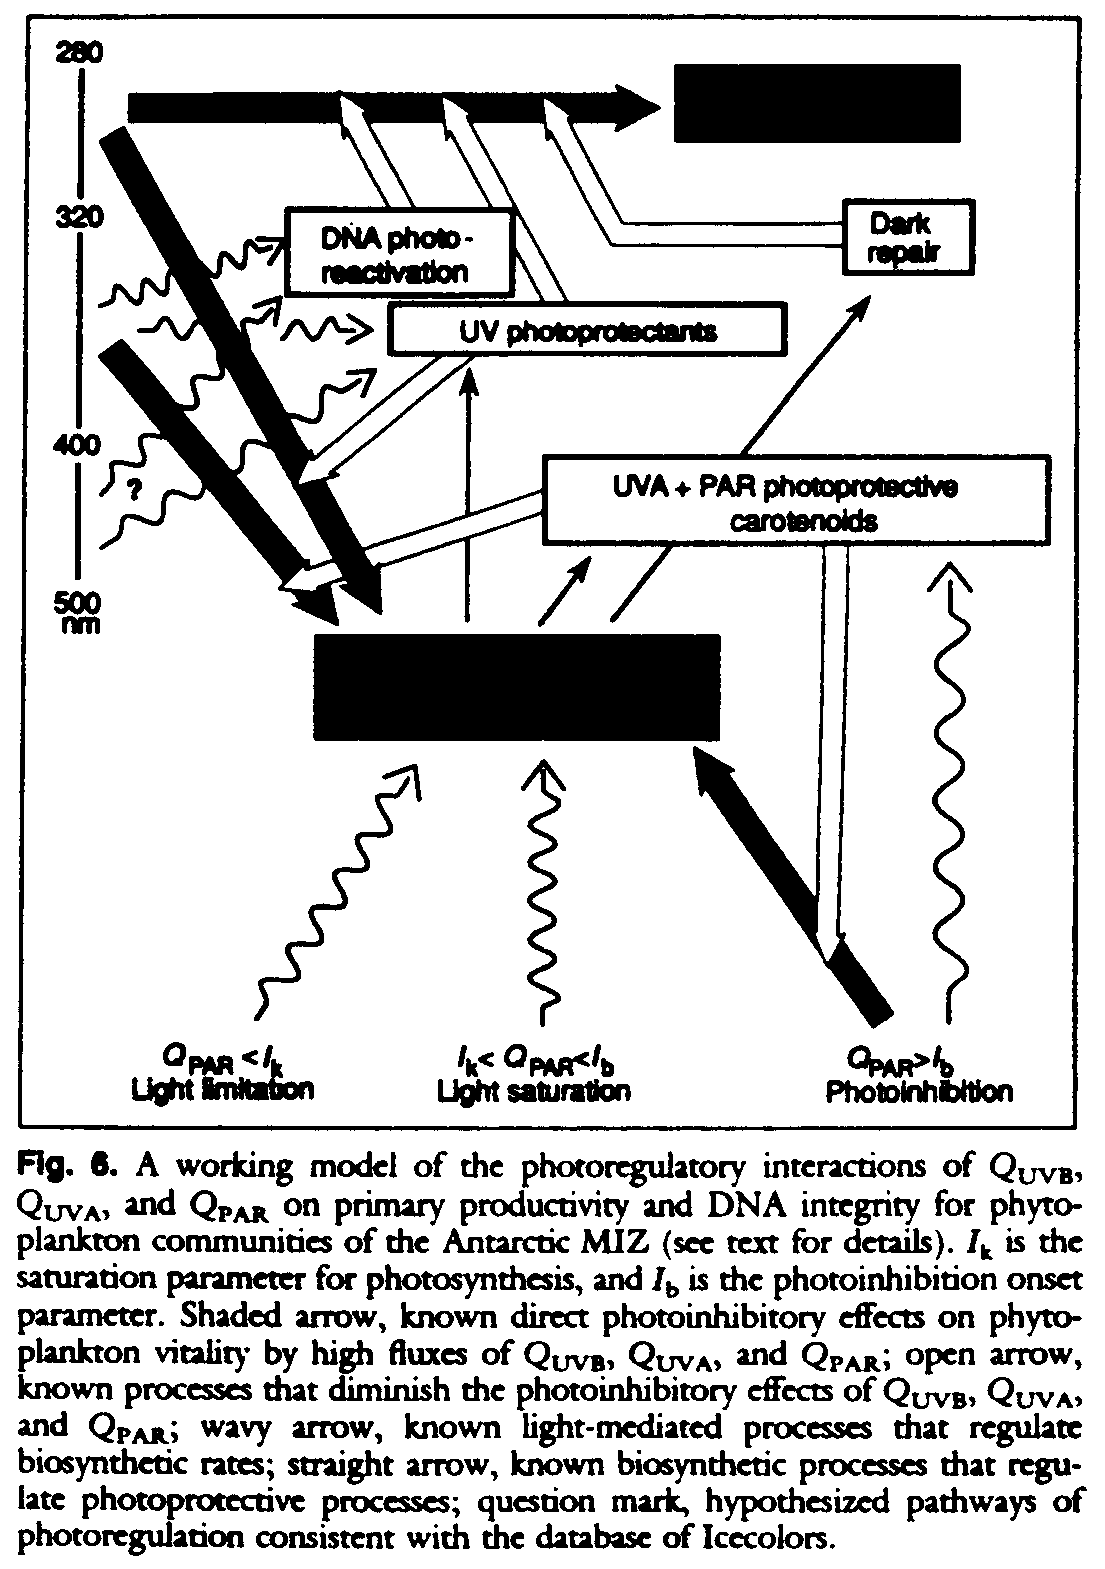
Figure 6 represents a working model that is consistent with Icecolors observations of the effects of QUVB, QUVA, and QPAR on primary productivity and DNA integrity for phytoplankton communities of the Antarctic MIZ. Although this working model is consistent with our experimental results, the causes of the depthrelated variations in UVB inhibition remain uncertain and are the subject of further investigations. Most pathways shown are known (93, 94), whereas the UVA photoregulation of cell responses to UVB radiation was deduced and is here proposed as the simplest mechanism to account for the subsurface maximum in UVB inhibition of rates of primary production. In this model, QUVB, QUVA, and QPAR act differentially to damage DNA integrity and photosynthetic processes. The rate of cell damage by these light-dependent processes may be offset by the rates of UVA+PAR-dependent photoreactivation, UV absorption by photoprotective MAAs, high-irradiance PAR induction of photoprotective carotenoids, and light-independent ("dark") DNA repair processes. In this model, the differing UVB exposure-to-response curve for surface and subsurface samples (Fig. 5, B and C) is consistent with the hypothesis that the remediation of UVB damage to cell vitality is initiated through UVA, but not UVB, photoreceptors. Under this hypothesis, phytoplankton are cued to short-term (minutes to a few hours) changes in UVA flux as an index of changing total UV flux. The use of QUVA as a signal for repair and photoprotective capabilibes would leave these phytoplankton unable to respond favorably to significant elevations in the ratio of QUVB:QUVA that, before the formation of the O3 hole, had been relatively fixed. Our findings and this working model are consistent with our original hypothesis that the ratios of QUVB:QUVA or QUVB:QPAR or both are critical determinants of susceptibility of Antarctic phytoplankton to O3 depletion.
For pelagic waters surrounding the MIZ of the Southern Ocean, current estimates of annual primary productivity are about 610 x 10[12] grams of carbon per year (76, 95, 96). Productivity estimates for the MIZ were derived by Smith and Nelson (48) with a simple model of ice-edge bloom genesis to be about 380 x 10[12] grams of carbon per year or about 40% of the total MIZ plus pelagic production south of the Antaraic Convergence. Thus, the MIZ potentially has a major role in the ecological and biogeochemical cycles of the Southern Ocean.
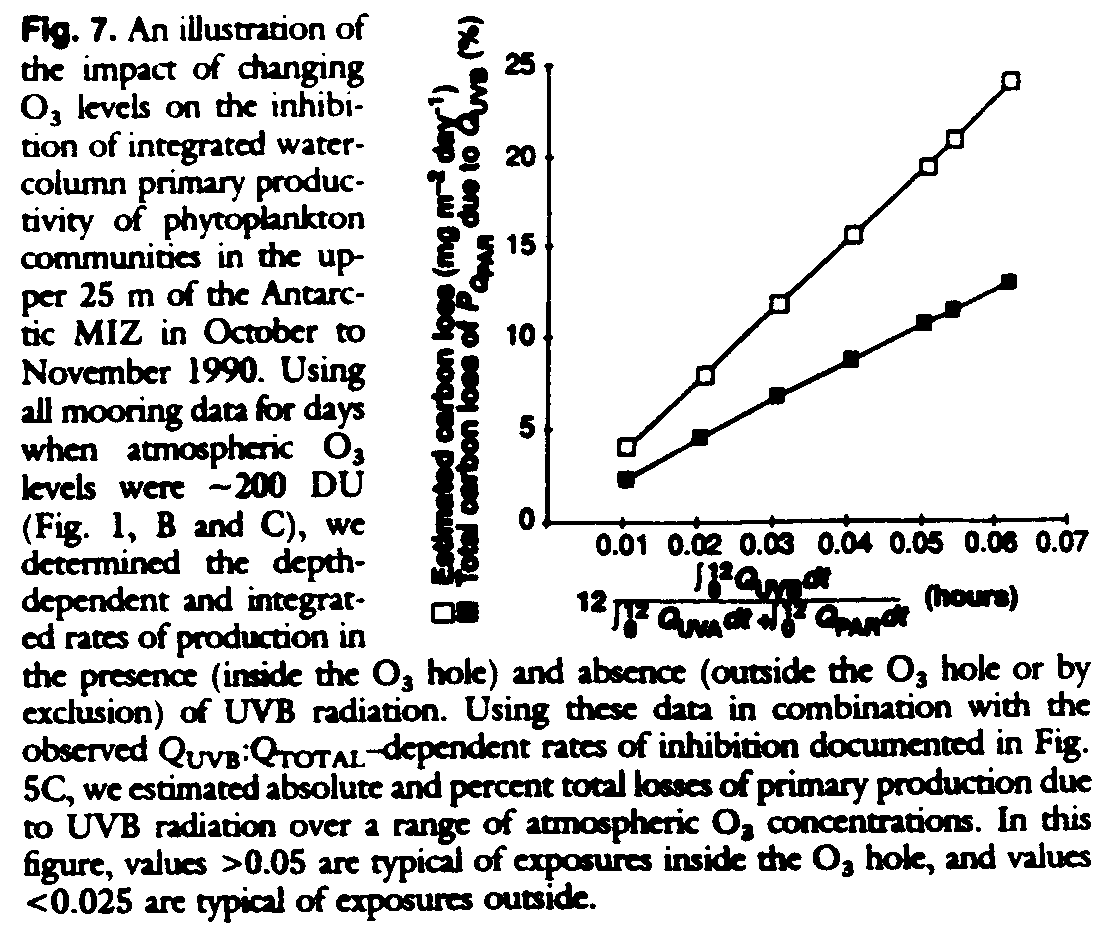
Our data permit an estimate to be made of the impact of the O3 hole on primary production for the MIZ of the Bellingshausen Sea. In situ production for moorings inside the O3 hole (stratospheric O3 levels less than 200 DU) can be directly compared with production for moorings outside the O3 hole (greater than 300 DU) as a function of depth and independent of any assumptions with respect to processes involved in the depth-related experimental results. Comparison of integrated productivity versus depth curves, with excluded UVB (from outside the hole) and with included UVB (from inside the hole), consistently show that higher UVB levels are associated with reduced (6 to 12%) water column productivity. As discussed above, QUVB is dependent on O3, solar elevation, and cloud conditions. The fitted relations between photosynthetic inhibition and QUVB:QTOTAL (Fig. 5C) permit an estimation of the impact of the O3 hole, independent of solar elevation and cloud conditions, and a generalization of results to the MIZ of the Bellinghausen Sea (Fig. 7). From these fitted data, and with each curve applied to the appropriate depth, we find that the reduction in productivity of the MIZ caused by O3 depletion is between 6 and 12%. This result is consistent with the above simple comparison of the productivity depth profiles inside and outside the O3 hole.
On the basis of these in situ data, one can make a yearly estimate of production loss for the Southern Ocean by assuming that this loss is reprcsentative of the entire MIZ and integrating production over this area and over the 3-month duration of the O3 hole during Antarctic spring. We estimate (using a 6% loss of water column productivity and conservatively assuming a given location is outside the O3 hole one-half of the time) that this productivity loss to the MIZ is 7 x 10[12] grams of carbon per year, corresponding to about 2% of the estimated yearly production of the MIZ. Our assumptions are such that this is a minimum loss estimate, and values could be at least twice these values depending on the specific space-time extent of the O3 hole. We have used short-term [14]C studies to assess changes in natural communities of phytoplankton caused by variations in the O3 hole that occurred on time scales fiom hours to weeks. Thus, the time scale of our experimental protocol matched that of the processes observed. Caution must be used when inferring longer term ecological consequences from short-term observations (16).
The interannual variability of primary production of the MIZ has been estimated to be substantial (97) and such that the maximum productivity is 50% greater than the minimum. This variability associated with the annual advance and retreat of paek ice is thought to be a major physical determinant of space-time changes in the structure and function of polar biota (48, 98). In particular, this interannual variability is likely to have a significant effect on total annual primary production, although to date these natural changes have not been accurately quantified. Thus, our estimated (2 to 4%) loss to MIZ productivity should be viewed in the context of a presumed natural variability of +/- 25%. Concern has been expressed (44) that O3-induced phytoplankton loss may trigger a positive feedback with respect to atmospheric CO2 that would excacerbate the greenhouse effect. Our estimated loss of 7 x 10[12] grams of carbon per year is about three orders of magnitude smaller than estimates of global phytoplankton production and thus is not likely to be significant in this context. On the other hand, we find that the O3-induced loss to a natural community of phytoplankton in the MIZ is measurable, and the subsequent ecologieal consequences of the magnitude and timing of this early spring loss remain to be determined.
____________________
2. J.G. Anderson, D.W. Toohey, W.H. Brune, Science 251, 39 (1991).
3. M.R. Schoeberl and D.L. Hartmann, ibid, pg. 46.
4. G. Brasseur, Environment 29, 6 (1987).
5. S. Solomon, Rev. Geophys. 26, 131 (1988).
6. _____, Nature 347, 347 (1990).
7. J.E. Frederick and H.E. Snell, Science 241, 438 (1988).
8. M. Crawford, ibid, 237, 1557 (1987).
12. D. Lubin et al., J. Geophys. Res. in press.
13. N.G. Jerlov, Nature 166, 111 (1950).
14. J. Lenoble, Ann. Geophys. 12, 16 (1956).
15. R.C. Smith and K.S. Baker, Photochem. Photobiol. 29, 311 (1979).
16. _____, Science 208, 592 (1980).
17. _____, Appl. Opt. 20, 177 (1981).
18. R.C. Worrest, H. Van Dyke, B.E. Thomson, Photochem. Photobiol. 17, 471 (1978).
19. R.C. Worrest, D.L. Broker, H. Van Kyke, Limnol. Oceanogr. 25, 360 (1980).
20. R.C. Worrest et al., Photochem. Photobiol. 33, 223 (1981).
21. R. C. Smith, K. S. Baker, O. Holm-Hansen, R. Olson, ibid. 31, 585 (1980).
22. J. Calkins and T. Thordardottir, Nature 283, 563 (1980).
23. G. Dohler, Mar. Biol. 83, 247 (1984).
24. D.-P. Hader and M. A. Hader, Arch. Microbiol. 150, 20 (1988).
25. L. A. Hobson and F. A. Hartley, J. Plankton Res. 5, 325 (1983).
26. P. L. Jokiel and R. H. York, Limnol. Oceanogr. 29, 192 (1984).
27. H. Maske, J. Plankton Res. 6, 351 (1984).
28. J. J. Cullen and M. P. Lesser, Mar. Biol. 111, 183 (1991).
29. O. Siebeck, Verh. Int. Ver. Limnol. 20, 2469 (1978).
30. J. J. Karanas, H. van Dyke, R. C. Worrest, Limnol. Oceanogr. 24, 1103 (1979).
31. J. R. Hunter, J. H. Taylor, G. Moser, Photochem. Photobiol. 29, 325 (1979).
32. D. M. Damkaer, D. B. Dey, G. A. Heron, Oecologia (Berlin) 48, 178 (1981).
34. D. M. Damkaer and D.B. Dey, Oceologia 60, 169 (1983).
35. J. Ringelberg, A. L. Keyser, B. J. G. Flik, Hydrobiologia 112, 217 (1984).
36. W. R. Jeffery, Dev. Biol. 140, 388 (1990).
37. J. M. Shick, M. P. Lesser, W. R. Stochaj, Symbiosis 10, 145 (1991).
41. R. C. Smith, Photochem. Photobiol. 50, 459 (1989).
42. _____ and K. S. Baker, Oceanography 2, 4 (1989).
43. L. Roberts, Science 244, 288 (1989).
44. M. A. Voytek, Ambio 19, 52 (1990).
45. D. Karentz, Antarct. Sci. 3, 3 (1991).
48. W. O. Smith, Jr., and D. M. Nelson, BioScience 36, 251 (1986).
49. D. L. Wilson, W. O. Smith, Jr., D. M. Nelson, Deep Sea Res. 33, 1375 (1986).
50. D. M. Nelson, W. O. Smith Jr., L. I. Gordon, B. A. Huber, J. Geophys. Res. 92, 7181 (1987).
51. D. M. Nelson et al., Deep Sea Res. 36, 191 (1989).
52. H. H. Gran, Rapp. P.V. Reun. Cons. Int. Explor. Mer. 75, 37 (1931).
53. P. T. Marshall, J. Cons. Cons. Int. Explor. Mer 23, 173 (1957).
54. H. J. Niebauer and V. Alexander, Cont. Shelf Res. 4, 367 (1985).
56. _____, Science 227, 163 (1985).
57. L. T. Molina and M. J. Molina, J. Geophys. Res. 91, 14 (1986).
58. M. M. Caldwell, Ecol. Monogr. 38, 243 (1968).
59. B. Buhlmann, P. Bossard, U. Uehlinger, J. Plankton Res. 9, 935 (1987).
60. T. Hirosawa and S. Miyachi, Arch. Microlbiol. 135, 98 (1983).
61. H. J. Morowitz, Science 111, 229 (1950).
62. R. G. Zepp and D. M. Cline, Environ. Sci. Technol. 11, 359 (1977).
64. A second-generation bio-optical profiling system BOPSII (65) was used to determine physical, optical, and biologica properties of the MIZ. This instrument, with a 12-bottle rosette (51 GoFlo bottles) and a depth capability of 500 m, was the principle hydrographic and sampling instrument for the cruise. Properties measured by the new instrument included temperature, conductivity bepth, up- and downwelling spectral irradiance (410, 441, 488, 507, 520, 565, 589, 625 nm), upwelled spectral radiance (410, 441, 488, 520, 565, 625, and 675 nm), downwelling scalar irradiance (410, 441, 488, 520, and 565 nm), beam transmittance (660 nm), stimulated chlorophyll fluorescence, in situ chlorophyl fluorescence, and Par. In addition, an Ocean Sensors Model 100 conductivity, temperature, and depth device (CTD) with a depth resolution of 3 to 5 mm was used to measure temperature (+/- 0.001deg.C) and conductivity (+/- 0.001 m ohm cm[-1]) fine structure to define the mixed layer and the mixing zones (66, 67) within the mixed layer.
65. R. C. Smith, C. R. Booth, J. L. Star, Appl. Opt. 23, 2791 (1984).
66. S. A. Thorpe, Philos. Trans. R. Soc. London Ser. A 286, 125 (1977).
67. T. M. Dillon, J. Geophys. Res. 87, 9601 (1982).
68. R. C. Smith, Z. Wan, K. S. Baker, ibid., in press.
69. A. Krueger, personal communication.
70. A. Torres, personal communication.
71. C. R. Booth, personal communication.
72. J. E. Frederick, H. E. Snell, E. K. Haywood, Photochem. Photobiol. 50, 443 (1989).
73. R. C. Smith and K. S. Baker, Proc. SPIE Ocean Opt. VII 489, 119 (1984).
74. _____, Proc. SPIE Ocean Opt. VIII 637, 95 (1986).
75. W. O. Smith, Jr. Oceanogr. Mar. Biol. 25, 11 (1987).
77. G. A. Fryxell, E. C. Theriot, K. R. Buck, Antarct. J. U.S. 19, 107 (1984).
78. R. A Perrin, P. Lu, H. J. Marchant, Hydrobiologia 146, 33 (1987).
79. W. O. Smith, Jr., et al., Nature 352, 514 (1991).
80. A. W. D. Larkum and J. Barrett, Adv. Bot. Res. 10, 1 (1983).
81. F. T Haxo, J. Phycol. 21, 282 (1985).
82. R. R. Bidigare, Photochem. Photobiol. 50, 469 (1989).
83. D. Karentz, J. E. Cleaver, D. L. Mitchell, Nature 350, 28 (1991).
84. _____, J. Phycol. 27, 326 (1991).
85. D. Karentz and L. H. Lutze, Limnol Oceanogr. 35, 549 (1990).
86. During Icecolors '90, suspended particulqate samples were screened for MAAs to assess their importance as UV blockers ion Antartic plankton. MAAs were separated and quantified by reversed-phase high-pressure liquid chromatography (HPLC) (87). The quantitatively important MAAs have tentatively been identified, on the basis of co-injection analysis and online diode array spectroscopy (280 to 400 nm), as porphyra-344 (max = 344 nm), shinorine
max = 334 nm), palythine (
max = 320 nm), and mycosporine-glycine:valine (
max = 336 nm). The former three compounds have recently been shown to ber present in intertidal diatoms, chlorophytes, and macroalgae collected near Palmer Station (90).
87. W. C. Dunhp and B. E. Chalker, Coral Reefs 5, 155 (1986).
88. _____,J. K. Oliver, J. Exp. Mar. Biol. Ecol. 104, 239 (1986).
89. J. I. Carreto, M. O. Carignan, G. Daleo, S. G. De Marco, J. Plankton Res. 12, 909 (1990).
90. D. Karentz, F. S. McEuen, M. C. Land, W. C. Dunlap, Mar. Biol. 108, 157 (1991).
91. K. Shibata, Plant Cell Physiol. 10, 325 (1969).
92. P. M. Sivalingham, T. Ikawa, Y. Yokohama, K. Nisizawa, Bot. Mar. 17, 23 (1974).
93. K. C. Smith, Ed., The Science of Photobiology (Plenum, New York, ed. 2, 1989).
94. B. B. Prézelin, M. M. Tilzer, O. Schofield, C. Haese, Aquat. Sci. 53, 136 (1991).
101. W. W. Giesks and G. W. Kraay, Limnol. Oceanogr. 28, 757 (1983).
102. W. W. C. Giesks and G. W. Kraay, Mar. Biol. 75, 179 (1983).
103. R. F. C. Mantoura and C. A. Llewellyn, Anal. Chim. Acta 151, 297 (1983).
104. R. R. Bidigare, M. C. Kennicutt II, J. M. Brooks, Limnol. Oceanogr. 30, 432 (1985).
105. R. R. Bidigare, O. Schofield, B. B. Prézelin, Mar. Ecol. Prog. Ser. 56, 177 (1989).
107. K. J. Waters, R. C. Smith, M. R. Lewis, Oceanography 3, 18 (1990).
108. H. R. Gordon, Appl. Opt. 24, 4172 (1985).
109. K. J. Voss, J. W. Nolten, G. D. Edwards, Proc. SPIE Ocean Opt. VIII 637, 186 (1986).
110. Replicate seawater samples from the BOPSII were filtered (0.2 m thick Millipore filters) immediately and frozen for subsequent nutrient analysis. All samples were measured within 4 days of collection. During sample analyses, standard calibration curves were measured every 4 hours for each nutrient (nitrate, phosphate, silicate) and were alwasy linear. Nitrate was measured by cadmium reduction via flow-injection analysis (99). Phosphate and silicate were measured colorimetrically (100). Water samples from the BOPSII were collected and immediately processec by HPLC, the definitive mehtod for separating and quantifying plant pigments (101-104) including accessory cartenoids (105). Chlorophyll a concentrations from all water samples were also determined flourometrically (106). Nutrient and pigment concentrations are given micromoles per liter and nanomoles per liter, respectively. Here 19'-hexanoyloxfucoxanthin (Fig. 3I) is a diagnostic tag for Phaeocystis spp., whichdominated the near-ice phytoplankton, and fucoxanthin (Fig. 3J) is a tag for diatoms that were found further out in the MIZ.
112. B. B. Prézelin and H. E. Glover, J. Plankton Res. 13 (suppl.), 45 (1991).