

The Energy-Industry Model computes the emissions of greenhouse gases in 13 world regions as a function of energy consumption and industrial production. End use energy consumption is computed from various economic/demographic driving forces.
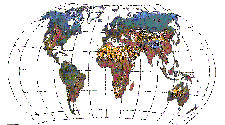
The Terrestrial Environment Model simulates the changes in global land cover on a grid-scale based on climatic and economic factors, and the flux of CO2 and other greenhouse gases from the biosphere to the atmosphere.
The Atmosphere-Ocean Model computes the buildup of greenhouse gases in the atmosphere and the resulting zonal-average temperature and precipitation patterns. The fully linked model has been tested against data from 1970 to 1990, and after calibration can reproduce the following observed trends:
The model can also simulate long term zonal average surface and vertical temperatures.
Four standard scenarios are included for selected aspects of the society- biosphere- climate system including primary energy consumption, emissions of various greenhouse gases, atmospheric concentrations of gases, temperature, precipitation, land cover and other indicators.
These scenarios, computed with IMAGE 2.0, are presented for selected aspects of the society-biosphere-climate system including primary energy consumption, emissions of various greenhouse gases, atmospheric concentrations of gases, temperature, precipitation, land cover and other indicators. Included are a "Conventional Wisdom" scenario, and three variations of this scenario :
CIESIN currently distributes The Conventional Wisdom Scenario. Third party users must in any presentation/publication of this material acknowledge the IMAGE project and RIVM with this phrase. Future enhancements include the inclusion of the other computed scenarios for distribution. Access to the IMAGE model will also be provided allowing third party users to submit scenarios for processing. The results, scenarios, may be nominated for distribution to the international community via CIESIN.
The documentation of the Image Model is primarily contained within these Mosaic pages. Two published artlices provide a detailed description of the model and computed scenarios (see section on Related Documentation)
Output files are provided in a variety of formats and layouts. Some files are aggregated tables spanning the entire simulation time, while others present data for typically 5-year intervals.
Calculations are performed with the Image Model for each 1/2 by 1/2 degree grid covering the entire globe. Most of the data presented involves only those gridcells with a portion of the grid coverage in land area (approximately 61,500 cells).
The model description and testing phases are described in detail in the articles presented within this page.
The contents of the output files are currently poorly described. In the future, more detailed readme files will be created describing the output data file contents. However, a brief summary is provided.
"Image2.0 Integrated Modeling of Global Climate Change, 1994".
    Edited by Joe Alcamo with papers by T he Image Group.
       Kluwer Academic Publishers, ISBN 0-7923-2860-4.
Modeling the Global Society-Biosphere-Climate System:
      Part I: Model Description and Testing.
Modeling the Global Society-Biosphere-Climate System:
      Part II: Computed Scenarios