 On April 13 th 2007 a massive storm developed over the state of Texas. By April 15 th the storm had followed the path of a Nor’easter, and snow and
rain had commenced falling over New York. By the time the storm had passed, more than 7 inches of rainwater had fallen in the New York City area.
On April 13 th 2007 a massive storm developed over the state of Texas. By April 15 th the storm had followed the path of a Nor’easter, and snow and
rain had commenced falling over New York. By the time the storm had passed, more than 7 inches of rainwater had fallen in the New York City area.
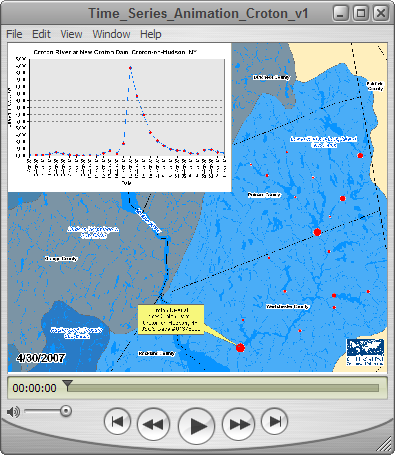
This animation highlights stream drainage just north of NYC in the Lower Hudson-Long Island sub-basin in April 2007 as recorded by United States Geological Survey (USGS) stream gages. More specifically, the graph focuses on a gage located on the Croton River at New Croton Dam, Croton-on-Hudson, NY. As you can see, the major rain event increased stream flow at New Croton Dam more than tenfold, and flow did not return to the monthly average until around April 24 th, 9 days after the rain event began.
Click the following links to view/download (behavior will depend on your browser and settings):
Time Series Animation (Quicktime ~8Mb)