Revised for: Global Environmental Change
January 20, 2004
Downscaling and Geo-spatial Gridding of
Socio-Economic Projections from the IPCC Special Report on Emissions Scenarios (SRES)
Stuart R. Gaffin1, Cynthia R. Rosenzweig1, Xiaoshi Xing2 and Greg Yetman2
Columbia University
1Center for Climate Systems Research
2880 Broadway
New York, NY 10025
Tel: 212-678-5640
Email: sgaffin@rcn.com
2Center for International Earth Science Information Network (CIESIN)
61 Route 9W
P.O. Box 1000
Palisades, New York 10964
U.S.A.
Abstract
A database has been developed containing downscaled socio-economic scenarios of future population and GDP at country level and on a geo-referenced gridscale. It builds on the recent Intergovernmental Panel on Climate Change (IPCC) Special Report on Emissions Scenarios (SRES), but has been created independently of that report. The SRES scenarios are derived from projected data on economic, demographic, technological and land-use changes for the 21st century in a highly aggregated form consisting of four world regions. Since analysts often need socio-economic data at higher spatial resolutions that are consistent with GCM climate scenarios, we undertook linear downscaling to 2100 of population and GDP to the country-level of the aggregated SRES socio-economic data for four scenario families: A1, A2, B1, B2. Using these country-level data, we also generated geo-spatial grids at 1/4o resolution (~30 kilometers at the equator) for population “density” (people/unit land area) and for GDP “density” (GDP/unit land area) for two time slices, 1990 and 2025. This paper provides background information for the databases, including discussion of the data sources, downscaling methodology, data omissions, discrepancies with the SRES report, problems encountered, and areas needing further work.
Introduction
Modeling
human societies, extrapolating current trends of socio-economic variables, and
projecting changed conditions for decades into the future present fundamental
problems. To a certain extent, socio-economic scenarios are, of necessity,
based on assumptions that are known to be tenuous. For instance, projecting
economic growth rates for century-long periods at fine scales may be impossible
and discontinuous events have rarely been predicted in advance. However,
tackling these problems contributes to the evaluation of societal responses to
major environmental issues, including, but not exclusively, global climate
change. Land-use change and ecosystem alteration are other important issues
that require similar analytical tools. Furthermore, these large-scale,
integrated, and highly complex problems need to be addressed at both global and
at local and regional scales for a comprehensive understanding.
The
work here presents an initial attempt at down-scaling socio-economic
projections that are consistent with existing projections of how global climate
may change in the future. We apply the SRES regional growth rates of population
and gross domestic product (GDP) uniformly to each country in 9-11 regions
defined by the emissions models used in SRES. The methodology is somewhat
analogous to that used in applying changes derived from coarse-resolution
global climate model output (e.g., temperature or precipitation), to
finer-scales for regional impact studies (e.g., IPCC, 2001).
Recent criticisms of the SRES report
have unfortunately created confusion and misinformation about the level of
regional disaggregation used in the SRES report (Castles and Henderson,
2003a). By referring to the downscaling
results presented in this paper, which were done independently and were made
available in draft online versions, they may have led some readers to think the
SRES report itself was done at a country level. The SRES report presented its results for four
reporting regions only (OECD, Asia, Eastern Europe + Former Soviet Union,
the Rest of World (ROW). No country level data or scenarios were developed or
presented. Indeed, even the more disaggregated SRES emissions models only
worked at the regional level. Recent replies by the SRES lead authors have
sought to correct the misinformation (Nakicenovic et al, 2003; Nakicenovic et
al, 2004).
Although we focus on the SRES
scenarios in this study, many alternative scenarios have been generated
independently of the IPCC (e.g., Hammond, 1998; GEO, 2002; DeVries et al, 1994)
and these have been used in various regional impact studies (e.g., Strzepek et
al, 2001). The SRES report was cognizant of many of these alternatives and
those scenarios that included greenhouse gas emissions were compared to other
available greenhouse gas and socio-economic projections (Nakićenović
et al, 2000).
Given the century-long timeframe for this
work, the resulting downscaled databases, especially that for GDP, are not
expected to be robust future predictions. Rather, they are analytical exercises
provided to explore a range of potential future conditions. Applications of this type of downscaled data
are only in the early stages (e.g., Arnell et al, 2003; Parry et al., 2004).
The country-level data may be used in global and regional (multi-country)
modeling of the human aspects of climate change (emissions, impacts,
vulnerability, and adaptation); the gridded data may be used as a component of
sub-national studies, all with appropriate caveats.
In this paper, we provide background
information about the SRES methods that are germane to the exercise and
describe the downscaling methodology for the population and GDP indicators at
both the country level and the geo-referenced gridscale. We highlight
difficultiess encountered, including lack of precise base-year agreement among
the SRES models, discontinuities that arise from downscaling the population
projections, very high 2100 incomes, and alternative GDP measures. Finally, we
highlight these and other areas that require more sophisticated treatment so as
to improve analytical tools available for integrated assessment of global
environmental change.
SRES Storylines, Regions, and Models
The IPCC Third Assessment Report (TAR) published the new set of emissions scenarios, called the Special Report on Emissions Scenarios (SRES), in 2000 (Nakićenović et al, 2000). The mandate for the new scenarios originated within the IPCC in 1996. One motivation was the need for an updated emissions series over the previous IPCC “IS92” series, given the changed geo-political landscape since 1990, such as the former Soviet Union and Eastern European political restructuring. The final emissions results of the SRES report are available online from Columbia University’s Center for International Earth Science Information Network (CIESIN) at: http://sres.ciesin.org/final_data.html. A complete online text of the SRES report is available at: http://www.grida.no/climate/ipcc/emission/
The SRES scenarios span the 21st century and project emissions for the major greenhouse gases, ozone precursor gases (CO, CH4, NOx, NMVOC’s), and sulfate aerosol emissions, as well as land use changes. Such emissions will drive climate change as well as atmospheric chemistry over the next century. Following their use in the IPCC TAR, the SRES framework has increasingly become a reference document for modeling the human dimensions component of impacts assessment (Gewin, 2002).
In addition, the scenarios synthesize a good deal more information than anthropogenic emissions, including the major driving forces behind human development including economic, demographic, social and technological change. These were included in SRES because all these factors play a role in energy consumption, land use patterns and emissions. A collateral benefit is that the SRES scenarios are useful for other research purposes on sustainable development.
In the SRES report, future world and regional population and GDP growth rate changes were adopted as exogenous drivers to the emissions models. In other words, the SRES models did not each develop their own projections for these factors but rather used harmonized data for population and GDP growth to 2100, that was agreed to by a consensus process among the SRES authors. A small range of differences of roughly 10% for the 1990 base year GDP estimates, were accepted within the modeling process (Nakicenovic et al, 2000).
Storylines
Four scenario “storylines” were
developed and labeled, for simplicity, A1, A2, B1, B2. These storylines were
the result of analyzing different viewpoints on possible future development
pathways by the members of the writing team. They have been discussed at length
elsewhere (Parry, 2000, Nakićenović et al, 2000) and will be
described only in briefest terms here.
Briefly, storyline A1
characterizes a market-based, technology-driven world with high economic growth
rates. World GDP reaches ~$550 trillion
(in 1990 US$) in 2100. Economic and cultural changes are characterized by
strong globalization. There is a rapid global diffusion of people, ideas and
technologies. Population growth is assumed to be low (~ 6.5 billion in 2100),
because of the importance of development in bringing about the demographic
transition from high to low fertility in developing countries. Low mortality is
assumed to correlate with low fertility. For these and related reasons, the
scenario assumes the IIASA “rapid demographic transition” population
projections (Table 1).
Storyline A2, in contrast, is a world of lower
economic development (GDP reaches $250 trillion in 2100) and weak
globalization. It is more prone to clashes between cultures and ideas, and
places a high priority on indigenous values. Population growth in A2 is high
(15 billion by 2100) because of the reduced financial resources available to
address human welfare, child and reproductive health and education. The
relatively higher fertility rates in this scenario are assumed to correlate
with higher mortality rates and so this scenario employs the IIASA “slow demographic
transition” population projections (Table 1). Per capita incomes are low.
Storyline B1 comes closest to a “sustainable
development” future where economic growth and environmental protection are
considered compatible. It too has high economic growth (GDP is projected to be
$350 trillion in 2100) although not as rapid as A1. B1 is a world where the
emphasis could be on education, equity and social welfare rather than on
technological growth. Environmental protection worldwide is considered a shared
priority by most nations and population growth is again low (IIASA “rapid”
population scenario; Table 1).
Finally storyline B2 is a
less prosperous version of B1 with slower economic growth (GDP is projected to
$250 trillion in 2100). Regional governance is more inward looking rather than
global. Cultural pluralism is strong along with environmental protection.
Technological changes diffuse slowly. Population growth is considered to be
medium in this scenario (10.4 billion in 2100). For this case, the SRES used
the UN 1998 medium long-range projection as described in Table 1. This is the
only SRES scenario using UN population data and also the only one with a
stabilizing population growth projection, with replacement level fertility
rates in the long-term.
SRES Reporting and Model Regions
The data published in the SRES
report are restricted to four aggregated “reporting regions:” (1) OECD
countries in 1990 (OCED90); (2) Reforming Economies of Eastern Europe and the
former Soviet Union (REF); (3) Asia; (4) the “Rest of the World” (ROW), or
Africa+Latin America+Middle East (ALM).[1]
However, the six emissions models
used in the SRES report used greater disaggregation, with regions numbering
between 9 and 13. Table 2 gives the breakdown by model of regions represented.
These model disaggregations are generally not the same as those used by the UN
and IIASA in their population projections. In our database we used the UN and
IIASA population disaggregations for the population downscaling and the SRES
model disaggregations for the GDP downscaling.
Since the SRES models generally had
a different regional breakdown compared to the UN and IIASA population
projections, each model had to adapt the UN and IIASA projections to their
model regions, as best they could. This process introduced some small
differences into the regional population totals from the SRES models as
compared to the original UN and IIASA data. This source of discrepancy will be
seen in comparison tables between the SRES models and the original UN and IIASA
population totals.
Marker Models
One of the conclusions of the SRES
report was that no particular model implementation of any of the SRES
storylines should be considered more ‘accurate’ than any of the other model
implementations (Grübler and Nakicenovic, 2001). Accordingly all six SRES
models implemented as many of the SRES scenarios as possible and all of the
model emissions results are recommended by the report to be treated as of equal
standing (Nakicenovic et al, 2000).
Nevertheless, for presentational
purposes, as a way of simplifying the findings, one model for each scenario
family was designated a ‘marker’ model. This meant that that model’s results
for a particular scenario were considered to be a good representative for the
family of runs for that scenario. For the A1 scenario, the marker model was the
AIM model (Table 2; Morita et al, 1994). For the A2 scenario, the marker model
was the ASF model (Pepper et al, 1992, 1998; Sankovski et al, 2000 ). For the
B1 scenario, the marker model was the IMAGE model (Alcamo et al, 1998; De Vries
et al, 1994, 1999, 2000). For the B2 scenario, the marker model was the MESSAGE
model (Messner and Strubegger, 1995; Riahi and Roehrl, 2000; Roehrl and Riahi,
2000). In addition to these marker models, two other emissions models were used
in the SRES report; the MiniCAM model (Edmonds et al, 1996) and the MARIA model
(Mori and Takahashi, 1999)
For our database, the distinction
of marker models mainly applies to the GDP downscalings because the population
projections are essentially independent of SRES, as generated by the UN and
IIASA. However, for the GDP
projections, the exact quantifications are model-specific, within a range
agreeing with the overall SRES harmonization for GDP growth rates. In order to
simplify the database, we have limited the GDP projection data to the marker
model for each of the four scenario families.
Downscaling Population Scenarios
We downscaled both the aggregated population and GDP data used in the SRES report to the country level out to 2100, using a simple linear downscaling method. This method is commonly employed by demographers needing state and local population projections that are consistent with larger regional or national projections (see e.g., Smith et al, 2001). Each country’s annual growth rate for population or GDP, at any year, was set equal to the regional growth rate within which each country resides. This method is mathematically equivalent to keeping the fractional share of each country’s population or GDP, relative to the regional population or GDP, constant, at the base year value, for the duration of the forecast period (Smith et al, 2001).
The results of the population
downscaling are available at: http://sres.ciesin.columbia.edu/tgcia.[2]
Population Base
Year
The base years of the UN, IIASA, and SRES population data are slightly different The base year for data in the SRES report was 1990. The base year for population projections available to SRES from the UN and IIASA was 1995, so a country-level population list for 1990 needed to be appended (Table 3). 1990 population estimates for 184 countries were obtained from the internet-accessible UN Common Statistics Database, located at: http://unstats.un.org/. The data were accessed in April 2002.
B2 Population
Downscaling
For three of the four SRES storylines (A1, A2, B1), the 1990 country-level population estimates were projected forward to 2100, using the aggregated regional projections from IIASA. For the B2 scenario, the projected country dataset only had to be generated after the year 2050, because this scenario used the UN 1998 Long Range population projection that extends the shorter-term 2050 projection that the UN undertakes at the country-level (Table 3) (UN, 1998). To get beyond 2050 however, the downscaling procedure had to be applied between 2055 and 2100.
For the B2 scenario, we apply the regional population growth rate (in percent/year), uniformly, to each country that lies within the more aggregated UN regions from the UN 1998 Long Range projection. The official UN version projects population for 8 regions of the world: Africa, Asia (minus India and China), India, China, Europe, Latin America, Northern America, Oceania. However, the UN also prepared an 'unofficial' Long Range projection specifically tailored for the IPCC SRES report for 11 regions of the world: North America, Western Europe, Pacific OECD, Central and Eastern Europe, Newly independent states of the former Soviet Union, Centrally planned Asia and China, South Asia, Other Pacific Asia, Middle East and North Africa, Latin America and the Caribbean, Sub-Saharan Africa. In our database, B2 population countries were grouped according the 11 regions corresponding to the ‘unofficial’ version.[3]
We explain the quantitative procedure,
using Angola as an example. Angola falls within the tailored UN projected
region Sub-Saharan Africa (SSA). Angola’s population projection from 1995 to
2050 is supplied by the UN 1996 Revision (UN, 1998). The SSA annual regional
population growth rate between 2050 and 2055 is calculated using the following
formula:
 (1)
(1)
Here, PSSA(2055) and PSSA(2050) are the regional SSA population totals from the UN for years 2055 and 2050, respectively. The log formula accounts for the fact that the annual growth rates are applied to a continuously changing population base.
Then, starting with Angola’s population in 2050, and using the above rate, Angola’s population in 2055 is projected as:
![]() (2)
(2)
Angola’s population in 2060 is
projected using the same formula, but substituting the appropriate rate and the
estimated population for 2055 on the right-hand-sign of (2), and so forth. We
followed this procedure for the entire country-level list in the base year.
Equations (1) and (2), applied
together, constitute a linear scaling of the country population changes with
the regional population changes. Since the rates are applied uniformly to each
country within a region, the method is linear with respect to regional totals.
This means that if we begin with a 1990 country population list that sums to
the exact 1990 SRES regional total, the agreement with the regional totals will
remain exact for the remainder of the downscaling period. Or, if the base year
country population sums to ±D% of the SRES regional total, this base year difference
will be exactly preserved at each time step for the remainder of the
downscaling period.[4]
However when the country lists are
subsequently summed to the larger four SRES reporting regions (Table 2), the
linearity is not preserved because of the changing contributing weights of each
of our regions to the SRES reporting regions. This feature will be seen in the
accompanying comparison tables, which show varying differences between our
totals and the published four SRES reporting region totals. The variance is not
large, however, and is usually at most a few percent.
The method above is mathematically identical
to keeping the ratio (or fraction) of a country’s population to the regional
population, constant over time. In other words, if a country starts off at x %
of some regional total, it remains x % for the duration of the downscaling
period. This can be understood by noting that if the ratio of a country
population to a regional population remains constant over time, the country
population will scale linearly with the regional population. If it scales
linearly with the regional population, the country and region will have the
same growth rates.
A1, B1 and A2 Population
Downscaling
The SRES A1-B1 and A2 population
scenarios for world regions were adopted in 2000 from population projections
realized at IIASA in 1996 and published in Lutz (1996). The IPCC SRES A1 and B1
scenarios both used the same IIASA "rapid" fertility transition
projection, which assumes low fertility and low mortality rates (Tables 1 and
3). The SRES A2 scenario used a corresponding IIASA "slow" fertility
transition projection (high fertility and high mortality rates) (Tables 1 and
3).
Both IIASA low and high projections
are done for 13 world regions, which are: North Africa, Sub-Saharan Africa,
China and Centrally Planned Asia, Pacific Asia, Pacific OECD, Central Asia,
Middle East, South Asia, Eastern Europe, European part of the former Soviet
Union, Western Europe, Latin America, North America. Detailed scenario
description and results for those regions are available at:
http://www.iiasa.ac.at/Research/POP/IPCC/index.html.
The downscaling from region to country level of the IIASA scenarios is based on the calculation of the fractional shares of each country into regions according to the year 2000 country population estimates and projections for 1990-2050, from the United Nations Population Division (UN, 2002). For each SRES population scenario, the United Nations variant that was the closest to the SRES scenario was chosen as the starting point for the population downscaling. For scenario A2, the United Nations 2000 high variant was used. According to this variant, the world population in 2050 will be 10.9 billions where as the A2 scenario gives a population of 11.3 billion 2050. For scenarios A1 and B1 the United Nations medium variant was chosen: according to this variant the world population in 2050 will be 9.3 billion whereas the SRES A1/B1 scenarios estimated that population will be 8.7 billion in 2050.
The United Nations country
age-specific populations were allocated into the 11 IIASA SRES regions
(originally, there were 13 regions in the IIASA projections, but the former
Soviet Union and Central Asia are brought together as well as Northern America
and Middle East). Then, a fractional share was calculated for each age group
(five-year age groups from 0 to 100+), for each country, from the total of the
regional age structure, as reconstituted from the United Nations 2000 data in
five-year periods from 1990 to 2050. These fractional shares were then applied
to the age structure of the population of the region in scenario A1-B1 and A2
from 1990 to 2050. After 2050, the shares of each country (by age groups) were
kept constant at the 2050 level and applied to the regional population from
2050 to 2100.
The results of this A1/B1 and A2
population downscaling are available at: http://sres.ciesin.columbia.edu/tgcia.
Population Downscaling Discontinuities
Artifacts arise with the present downscaling procedure for the four scenarios. The problems occur because of the post-2050 transition to the uniform growth rate method. If a country is projected by the UN Revision to have a declining (or growing) population at 2050 but falls within a larger region that has a growing (or declining) population after 2050, a discontinuity will occur. For example, Cuba and Barbados are problematic in this regard. Results such as these cannot be used. Other countries may have a slower or faster projected growth rate at 2050 than the regional projection. In these cases, the population slope for such countries will show a discontinuity, post-2050.
If we attempt to remove these discontinuities on a case-by-case basis, such as by using additional country-specific information, or even deleting them from the database altogether, then the regional totals will develop additional discrepancies with those in the SRES report. If problematic results for specific countries are to be deleted, this will require relaxing constraints on regional consistency with the SRES report. Removing such discrepancies will require more sophisticated treatments.
Alternative methods do exist for downscaling regional population projections to smaller locales (e.g., Gabbour, 1993; Pittenger, 1976, 1980; Smith et al, 2001). Two other extrapolation methods used by state and local demographers make use of recent historical data to estimate current trends in fractional shares and then to hold these trends constant over the forecast period (Gabbour, 1993; Pittenger, 1976, 1980).
In the first alternative, the trend
in fractional share of regional population size is kept constant
(Gabbour, 1993). In the second alternative, the trend in fractional share of
the regional population growth rate is kept constant (Pittenger, 1976;
Smith et al, 2001). Such methods could
be applied to the population downscalings performed in this paper by
calculating 2050 trends in shares of population size and growth using the UN
country projections for 2045-2050, and then holding these trends constant
beyond 2050. It is possible these alternative methods might weaken or reduce
the discontinuities in population change that we observe with the constant
fractional shares method, although this will require further investigation. A
disadvantage, which may preclude their use for further development of the
current database, is that such extrapolations may cause other difficulties if
used for long timeframes beyond 2050 and out to 2100. One problem is that a
declining local fractional share could lead to negative population sizes if
extrapolated for sufficiently long periods. Other interpretation problems with
declining fractional shares also arise when countries are embedded within
growing population regions (Smith et
al, 2001). We are exploring the use of such alternative downscaling approaches
in current work.
Downscaling GDP Projections
Along with population growth, economic
growth rates were a second, exogenous, assumption incorporated within the four
IPCC SRES scenario families. As explained in the SRES report (see especially
sections 4.2.2 and 4.3), economic growth rates were assumed to be "very
high" for the A1 family, "medium" for the A2 family,
"high" for the B1 family and "medium" for the B2 family.
Quantitatively, these assumptions translated into World GDP for 2100 of between
522-550 trillion US1990$ (aggregated total based on market exchange rates)/year
for the A1 family, 197-249 trillion US1990$/year for the A2 family, 328-350
trillion US1990$/year for the B1 family and 199-255 trillion US1990$/year for
the B2 family. The corresponding per capita GDP growth rates depend on the
corresponding regional population data used in the SRES report.
GDP Base Year
Issues
The 1990 base year GDP data were
downloaded from a national accounts database available from the UN Statistics
Division. The data were accessed in May 2002 at: http://unstats.un.org.
From this database we originally selected the series titled: “GDP
at market prices, US$, current prices (for 1990) (UN estimates).”
The UN definitions for market and current prices are given in the footnotes
below.[5],[6]
However, for reasons that reasons that probably related to the complex economic
restructuring occurring at that time, the GDP data from this source for Eastern
Europe and the former Soviet Union (which together comprise the REF SRES
region) are significantly too high compared to the SRES REF estimate (N.
Nakicenovic, pers. comm.).
To remedy this discrepancy we
downloaded from the same UN database a second GDP series list entitled: “GDP
at market prices, current US$ (for 1990) (World Bank estimates)”. This
data derives from the World Bank’s Development Indicator Reports. When summing
this data, we find it shows a much closer agreement with SRES for the REF
countries. However, the World Bank country list is shorter than the UN’s list.
As an interim solution, in the interests of developing as global a database as
possible, we have decided to use the World Bank estimates for as many countries
as they provide, and especially for the REF countries. For missing countries in
other regions we use the UN estimates.[7]
Downscaling methods
The downscaling of the SRES GDP
projections for individual countries was developed using the same regional
growth rate method applied to the population data, and as given by equations 3
and 4. In these equations, Angola is again used as an example. As with
population, SRES regional GDP growth rates were calculated from the marker
model regional data and applied uniformly to each country that fell within the
SRES-defined regions.
 (3)
(3)
![]() (4)
(4)
A key difference between the
application of this procedure to GDP and population is that uniform GDP growth
rates were necessarily applied starting in the base year of 1990. With
population, uniform growth rates were applied only after 2050. (Prior to that
UN Revision population data were available to simulate near term country
population growth rates changes over time.) Therefore our GDP downscaling
introduces inaccurate national GDP growth rates in the near-term, when compared
to actual near-term data for countries, because current national GDP growth
rates are obviously not uniform within regions.
Our results for the GDP downscaling
are presented online at: http://sres.ciesin.columbia.edu/tgcia.
Methodological Issues
GDP versus PPP Measures of Economic
Development
The GDP totals above were expressed in
terms of 1990 US $, where the aggregation between countries for 1990 was done
using 1990 market exchange rates for individual currencies. The implications of
using market exchange rate (MEX) versus purchasing power parity (PPP), for the
purposes of aggregating country GDP data to a regional level, as well as
alternative measures of economic development, were explored in the SRES report
(SRES, 2000). A discussion is now on-going regarding whether exclusive reliance
on one or the other measure would significantly change greenhouse gas emissions
projections from energy models (see Nakicenovic et al 2003, 2004; Castles and
Henderson, 2003b, 2004).
Some users may prefer one GDP measure
to another for different impact analyses. The disaggregated GDP data supplied
to the authors from the set of SRES marker models were more readily available
in market exchange rates, so the initial downscaling of GDP to the country
level was first attempted using the MER data. While the current database
provides the MER measure only, we are exploring the possibility of providing a
PPP version as well.
High 2100 GDP Per Capita Values
One finding of the database
development exercise is that the regional growth rate methodology can produce
very high 2100 per capita incomes We highlight below some examples of anomalous
values that results from the downscaling. However, we wish to avoid setting
“acceptability” criteria to screen the results, because values that appear to
be “acceptable” or “unacceptable” to us may be judged differently by
others. We leave the development of
such criteria to the individual user.
High 2100 values typically occur for
countries with high 1990 incomes that also happen to lie within high SRES GDP
growth rate regions. Examples of countries for which this was particularly
severe include the following: (1) Singapore, (2) Hong Kong, (3) French
Polynesia, (4) New Caledonia, (5) Brunei Darussalam, (6) Reunion, (7) Republic
of Korea, (8) Gabon, (9) Mauritius. What are, no doubt, extremely high per
capita incomes in 2100 occur. While we would prefer not to list such GDP values
for these countries, excluding them from the database would introduce
artificial regional discrepancies when compared to the SRES. A disclaimer is
included in the on-line presentation that states, in addition to the 9
countries listed above, “ …other countries might have to be excluded for
similar, if not as extreme, reasons…”
Other countries that have high 2100
per capita GDP values, and that for the B1 scenario, in particular, surpass
that of the U.S. in 2100: Germany, Italy, France and Japan among the
OECD90 countries; the Russian Federation and the Baltic States (Estonia, Latvia
and Lithuania) among the countries in transition; the Republic of [South]
Korea, the Democratic People's republic of [North] Korea, Malaysia, Singapore
and Hong Kong among Asian countries; and South Africa, Libya, Algeria, Tunisia,
Saudi Arabia, Israel, Turkey and Argentina among the 'Africa, Latin America and
the Middle East' group of countries (Castles and Henderson, 2003a).
There are several related reasons why some countries display
potentially problematic per capita GDP growth. In some cases (e.g., the Asian
and developing countries cited above), countries with relatively more affluent
economies (i.e., relative to other countries in the region) and
relatively smaller and slower-growing populations) lie within regions with
rapidly increasing GDP SRES growth rates. In other cases (e.g., the OECD90,
Eastern European and former Soviet Union countries cited above), the projected
long-term declines in population for the B1 (and A1) scenarios, play an
important role in creating the high 2100 per capita income GDP levels for these
countries. Moreover, in contrast, the
U.S. population between 1990 and 2100 is projected to nearly double to ~460
million, and this increase also plays a role in diluting U.S. per capita
incomes relative to other countries experiencing less rapid population increases
and, or, declines.
More generally, these high incomes found in some countries and in some scenarios are the consequence of applying such a simple and coarse regional growth rate methodology to individual countries. Clearly more sophisticated and disaggregated algorithms are needed. Had the models in the SRES report been equipped for higher levels of disaggregation, the models would have adjusted the specific GDP growth rates by country, so that the more affluent economies in very poor regions (e.g., South Africa) would not experience the same rates of development as neighboring poor countries in Sub-Saharan Africa that are in the early phases of industrialization.
Another possible method would be to use the logic of the storylines for the downscaling. For example, country-level GDP growth rates could be linked to GDP per capita levels as was done for the four different storylines on the level of global regions (Nakicenovic et al, 2000). Then, a number of different calibrations could have been applied that yield the same SRES regional GDP levels, but with different country development paths.
Geo-Spatially Referenced Grids for Population and GDP
Description of the Gridded Population of
the World (GPW) Map
Demographic information, including projections, is often provided on a national basis but global environmental and other cross-disciplinary studies increasingly require data that are referenced by geographic coordinates, such as latitude and longitude, rather than by political or administrative units. The potential utility of such geo-spatial data was a motivation behind development of the Gridded Population of the World (GPW) map (CIESIN et al, 2000). In the GPW data set, the distribution of human population has been converted from national and sub-national units to a series of geo-referenced quadrilateral grids. Version 2 of GPW provides estimates of the population of the world in 1990 and 1995. A full description of GPW can be found at: http://sedac.ciesin.org/plue/gpw. Figure 1a (top) displays the 1990 GPW, using the same UN 1990 country-level population estimates that are in our database.
Using the country-level population projections from the first part of this paper, it is a simple matter to ‘project’ GPW forward in time. Figure 1b (bottom) displays the 2025 projection of GPW, using the B2 scenario country-level population projection. For this projection, the year 2025 projected population of each country replaces the 1990 estimate.
Although the country-level populations change, the fractional distribution of population at each grid cell is the same as the 1990 GPW, sub-nationally. This simplification may be dealt with in further revisions by including additional data on sub-national population projections. For a near-term projection, such as 2025, a number of sub-national projections are available. For example, the US Census Bureau produces state level population projections out to 2025 (US Census Bureau, 2002).
Despite the static sub-national spatial assumptions, there are, of course, significant international redistributions of population density implicit in the 2025 projection. One source is the varying international fertility and mortality rates which lead to differential population growth and decline rates in the projection. A second source is due to migration. Within-country migration, while potentially important in many nations, is not included in the scope of this study. The UN 1996 Revision, upon which the B2 scenario is based, incorporates international migration rate assumptions out to 2025 (Table 3). For countries with a long history of international migration, the projection assumes that the regular flow will continue to 2025.
It is difficult to detect visual changes in figure 1 because areas of currently high population density will continue to have high densities in the near term. A clearer way to see changes in international population distribution is to show the change in population density between the two years (figure 2). The world population in 2025 is projected in this scenario to be 2.76 billion greater than in 1990. Although many of the current areas of high population density will continue to increase over the next two decades, other areas will experience declines, such Eastern and parts of Western Europe, the former Soviet Union and Japan. This decline was alluded to in connection with GDP per capita changes in Europe and the former Soviet Union.
Description of GDP/unit area (“GDP density”) Map
A geo-spatial distribution of GDP per unit area (GDP “density”), closely related to the GPW map, has been developed by Sachs et al (2001). The basic idea is to apply national and, where available, sub-national data on GDP per capita to GPW. GDP per capita can be multiplied by population per unit area at each grid point of the GPW map. The resulting spatial indicator is then GDP per unit area, referred as GDP density.[8]
In the Sachs et al (2001) study, gross national product (GNP) per capita was measured at standardized purchasing power parity (PPP), at both the national and sub-national level for 1995. To capture intra-country variance in income distribution, sub-national (first level state/province divisions or non-administrative regions) per capita GDP data was gathered for 19 of 152 countries in a geographic information system, including most of the large economies.
Since the downscaling presented within this paper has dealt firstly with MER-based GDP data, we have generated a market exchange rate version of the Sachs et al (2001) GDP density map. We have also not yet applied sub-national GDP data to the map. Economic inequality within countries will not be accurately captured without such data, and inequality and related variations in access to resources are important determinants of vulnerability and adaptive capacity.
A 1990 GDP grid, shown at the top of figure 2, forms a baseline for our spatial GDP projections. We first used the 1990 country level population and GDP estimates to calculate 1990 per capita GDP. The map of GDP density is then calculated within a geographic information system by multiplying GDP per capita by the gridded population of the world. This multiplication converts the units of “GDP per capita” into GDP per unit area, because GPW is in units of population/unit area.
As with the 2025 population map, it is a straightforward exercise to generate a 2025 GDP density grid (figure 3b). Note that both the projected 2025 population and GDP elements go into this grid. For the B2 GDP scenario, world GDP begins at ~21.7 trillion (1990) US$ and increases to ~59 trillion (1990) US$ by 2025. The visual changes in GDP density are somewhat clearer in this map than the population map, partly because the percentage increases in GDP are greater than for population. Particularly evident are the increases in GDP in Southern and South Eastern Asia, Sub Saharan Africa and Latin America.
It is anticipated that the population and GDP density grids are potentially useful data for analysts concerned with assessing ‘vulnerability’ and ‘adaptive capacity,’ as defined bythe IPCC (IPCC, 2001), to future global and regional environmental changes and stresses. Broadly speaking, vulnerability indicators to climate change would likely include estimates of present or future populations at risk. Similarly, indicators for adaptive capacity may include an estimate of the state of development, or income, for those populations at risk. The high resolution maps could assist detailed spatial studies of these indicators.
Conclusions
This paper has presented the development of a socio-economic database constructed based on the SRES report. A primary motivation for this work is to promote consistency between energy-econometric models that simulate greenhouse gas emissions, climate models that simulate the physical aspects of global climate change, and social sciences models that characterize the potential impacts on human welfare from global warming. The IPCC SRES report is a logical foundation for such a database because it represents a synthesis of the socio-economic and technological driving forces important for human impacts and the greenhouse emissions that may affect future climate. By developing the database, we sought to overcome a main obstacle of the SRES report for many human impacts studies; namely that the data presented therein exist in highly aggregated form, at a spatial scale too coarse for many local and regional analyses.
A number of problems emerged from the work. For the population downscaling, the main problem is the adoption of a uniform regional growth (or decline) rates after 2050, the end point of the UN country-level population projections. This introduced significant discontinuities in the population trend slopes for countries whose 2050 population growth rates differ significantly from the regional growth rates. Two potential alternative algorithms for downscaling involve using trend data of changing fractional shares of population size and growth rate. These may change the degree of the discontinuities and should be investigated.
Ideally, the best solution for population would be to adopt quality country-level projections to 2100, which are developed by some demographic research groups. However, in regard to SRES, neither the UN nor IIASA have, as yet, produced projections at the country level out to 2100.
With respect to the projected regional GDP data, three main problems have been identified: (1) The downscaling methodology begins in 1995 and uses uniform regional growth rates from that point in time onward. As a result, current near-term differences in GDP growth rates between countries are not captured and our data readily show discrepancies with actual near-term country data. (2) For countries that have high 1990 GDP per capita values, and which also lie within developing regions with high anticipated GDP growth rates, 2100 GDP per capita can reach problematic high values. To project the GDP per capita for such countries will require more disaggregated treatments and probably relaxing the constraint for exact regional consistency with the SRES report. (3) The MER GDP data from the SRES marker models were used in the database for both the country-level and gridded values. For issues involving assessments of poverty and wealth, which are often important components of climate vulnerability and adaptation studies, national PPP data provides an alternative, and, in some cases, a more appropriate measure than traditional market-based GDP. The SRES did develop PPP trajectories, and down-scaling these values would be an area for future database development.
Provision of socio-economic scenarios for use in global climate change studies at national and gridded scales is a daunting challenge. To do the job carefully in a “bottom-up” approach, determining grid-by-grid or country-by-country values in a consistent manner would be an enormous task. On the other hand, the top-down approach, such as has been employed here, brings the types of methodological problems that we have presented in this paper. Answering this challenge calls for the development of multiple approaches and new methods, with clear recognition of the manifold uncertainties. We hope that the work presented here stimulates other researchers to take up and continue in this important task.
References
Alcamo, J., Leemans, R. and Kreileman, E. (1998) Global Change Scenarios of the 21st Century. Results from the IMAGE 2.1 model, Elsevier Science, London.
Arnell, N., Livermore, M. J. L., Kovats, S., Levy, P., Nicholls, R., Parry, M. L. and S. R. Gaffin (2003), Climate and Socio-Economic Scenarios for Global-Scale Climate Change impacts assessments: Characterising the SRES Storylines, submitted to Global Environmental Change, June 2003.
Castles, I. and D. Henderson (2003a), IPCC Issues: A Swag of Documents, Document 3: Further Considerations, http://www.lavoisier.com.au/papers/articles/IPPCissues.html#anchor1592472 (accessed January 2004.)
Castles,
I. and D. Henderson (2003b), The IPCC Emissions Scenarios: An Economic and
Statistical Critique, Energy and
Environment, v. 14, no. (2,3), p. XX-XX.
Castles
I. and D. Henderson (2004), XXX, XXX, Energy and
Environment, v. 14, no. (4), p. XX -XX
Center for International Earth Science Information Network (CIESIN), Columbia University (2000) Gridded Population of the World (GPW), Version 2. Palisades, NY: CIESIN, Columbia University. Available at http://sedac.ciesin.org/plue/gpw
De Vries, B., van den Wijngaard, R.A., Kreileman, G.J.J., Olivier, J.G..J. and Toet, A.M.C. (1994) A model for calculating regional energy use and emissions for evaluating global climate scenarios. Water, Air and Soil Pollution 76, 79-131.
De Vries, B., Janssen, M. and Beusen, A.(1999) Perspectives on global energy futures – simulations with the TIME model. Energy Policy 27, 477-494.
De Vries, B., Bollen, J., Bouwman, L., den Elzen, M., Janssen, M., and Kreileman, E. (2000) Greenhouse gas emissions in an equity-, environment-and service-oriented world: an IMAGE-based scenario for the next century. Technological Forecasting & Social Change 63(2-3), 137-174.
Doll, C.N.H., Muller, J-P., Elvidge, C.D. (2000) Night-time imagery as a tool for global mapping of socio-economic parameters and greenhouse gas emissions. Ambio 29(3), 157-162.
Edmonds, J. M., Wise, R., Pitcher, H., Richels, R., Wigley, T. and C. MacCracken (1996) An integrated assessment of climate change and the accelerated introduction of advanced energy technologies, an application of MiniCAM 1.0. Mitigation and Adaptation Strategies for Global Change 1(4), 311-319.
Elvidge, C.D., Baugh, K.E., Kihn, E.A., Kroehl, H.W., Davis, E.R. and Davis, C.(1997a) Relation between satellite observed visible to near infrared emissions, population, and energy consumption. International Journal of Remote Sensing 18, 1373-1379.
Elvidge, C.D., Baugh, K.E., Hobson, V.H., Kihn, E.A., Kroehl, H.W, Davis, E.R. and Cocero, D. (1997b) Satellite inventory of human settlements using nocturnal radiation emissions: a contribution for the global toolchest. Global Change Biology 3(5), 387-395.
Gabbour, I. (1993) SPOP: Small-Area Population Projection, In Klosterman, R., Brail, R. and E. Bossard (eds.) Spreadsheet models for urban and regional analsis (pp. 69-84), New Brunswick, N.J.; Center for Urban Policy Research, Rutgers Univesity.
Gaffin, S. R. (1998) World population projections for greenhouse gas emissions scenarios. Mitigation and Adaptation Strategies for Global Change 3(2-4), 133-170.
Gewin, V.(2002) Ecosystem health: the state of the planet. Nature 417, 112-113.
Global Environmental Outlook 3 (2002), United Nations Environment Program, Earthscan Press, Nairobi, Kenya.
Grübler, A. and N. Nakicenovic (2001) Identifying dangers in an uncertain climate. Nature 412, 15.
Hammond, A. (1998) Which world ?: scenarios for the 21st century, global destinies, regional choices. Island Press, Washington, D.C.
Intergovernmental Panel on Climate Change (IPCC) (2001) Climate change 2001, impacts, adaptation and vulnerability. (eds.) McCarthy, J. J., Canziani, O. F., Leary, N. A., Dokken, D. J. and White, K.S. Cambridge University Press, Cambridge.
Lutz, W. (ed.) (1996) The future population of the world: what can we assume today? 2nd Edition, Earthscan, London..
Messner, S., and Strubegger, M. (1995) User’s guide for MESSAGE III, WP-95-069. International Institute for Applied Systems Analysis, Laxenburg, Austria.
Mori, S., and Takahashi, M. (1999) An integrated assessment model for the evaluation of new energy technologies and food productivity. International Journal of Global Energy Issues 11(1-4), 1-18.
Morita, T., Matsuoka,Y., Penna, I. and Kainuma, M. (1994) Global carbon Dioxide emission scenarios and their basic Assumptions: 1994 Survey. CGER-1011-94. Center for Global Environmental Research, National Institute for Environmental Studies, Tsukuba, Japan.
Nakicenovic, N. et al, (2004) Emissions Scenarios and the Work of the IPCC: A final response to Drs Castles and Henderson, Energy and Environment, in press.
Nakicenovic, N., Grübler, A., Gaffin, S., Jung, T., Kram, T., Morita, T., Pitcher, H., Riahi, K., Schlesinger, M., Shukla, P. R., van Vuuren, D., Davis, G., Michaelis, L., Swart, R. & N. Victor (2003), The IPCC SRES Scenarios Revisited: A Response, Energy and Environment, v. 14(2, ) p. 187-214.
Nakićenović, N. et al (2000) Special report on Emissions
scenarios: A special report of working group III of the Intergovernmental Panel
on Climate Change. Cambridge University Press, Cambridge.
O’Neill, B., Balk, D., Brickman, M. and Ezra, M. (2001) A guide to global population projections. Demographic Research 56(3), 203-288.
Olivier, J.G.J., Bouwman, A.F., van der Maas, C.W.M., Berdowski, J.J.M., Veldt, C., Bloos, J.P.J., Visschedijk, A.J.H., Zandveld, P.Y.J., and Haverlag, J.L. (1996) Description of EDGAR version 2.0: a set of global emission inventories of greenhouse gases and ozone-depleting substances for all anthropogenic and most natural sources on a per country basis and on 1o×1o grid. Report 771060002, National Institute of Public Health and the Environment, Bilthoven, the Netherlands.
Parry, M. L. (ed.), (2000) Assessment of Potential Effects and Adaptations for Climate Change in Europe: Summary and Conclusions, Jackson Environment Institute, University of East Anglia, Norwich, UK.
Parry, M.L., C. Rosenzweig, A. Iglesias, M. Livermore, and G. Fischer (2004) Assessing the effects of climate change on global food production under differing socio-economic scenarios. Global Environmental Change (in press).
Pepper, W.J., J. Leggett, R. Swart, J. Wasson, J. Edmonds, and I. Mintzer (1992) Emissions scenarios for the IPCC. An update: Assumptions, methodology, and results, Support document for Chapter A3. In Climate Change 1992: Supplementary Report to the IPCC Scientific Assessment. J.T. Houghton, B.A. Callandar, S.K. Varney (eds.), Cambridge University Press, Cambridge.
Pepper, W.J., Barbour, W., Sankovski, A., and Braaz, B. (1998) No-policy greenhouse gas emission scenarios: revisiting IPCC 1992. Environmental Science & Policy 1, 289-312.
Pittenger, D. (1976) Projecting State and Local Populations, Ballinger, Cambridge, MA.
Pittenger, D. (1980) Some Problems in Forecasting Population for Government Planning Purposes, American Statistician, v. 34, p. 135-139.
Riahi, K. and Roehrl, R.A. (2000) Greenhouse gas emissions in a dynamics-as-usual scenario of economic and energy development. Technological Forecasting & Social Change 63, 175-205.
Roehrl, R.A. and Riahi, K. (2000) Technology dynamics and greenhouse gas emissions mitigation - a cost assessment. Technological Forecasting & Social Change, 63, 231-261.
Sachs, J. D., Mellinger, A. D. and J. L. Gallup (2001, March) The geography of poverty and wealth. Scientific American 70-75.
Smith, S. K., Tayman, J. and D. A. Swanson (2001) State and Local Population Projections: Methodology and Analysis, Kluwer Academic/ Plenum Publishers, New York, 426 pages.
Smith, S. K., Tayman, J. and D. A. Swanson (2001) State and Local Population Projections: Methodology and Analysis, Kluwer Academic/Plenum Publishers, New York, 426 pages.
SNA (1993), United Nations, Commission of the European Communities, International Monetary Fund, Organisation for Economic Cooperation and Development and World Bank. System of National Accounts 1993 (SNA 1993). Series F, No. 2, Rev. 4 (United Nations publication Sales No. E.94.XVII.4). (paras. 2.68 and 1.62)
Strzepek, K., Yates, D., Yohe, G., Tol, R.S.J. and Mader, N. (2001) Constructing "not implausible" climate and economic scenarios for Egypt, Integrated Assessment, 2, 139-157.
Sutton, P., Roberts, D., Elvidge, C.,and Meij, H. (1997) A comparison of nighttime satellite imagery and population density for the continental United States. Photogrammetric Engineering and Remote Sensing 63, 1303-1313.
Sutton, P. and Costanza, R. (2002) Global estimates of market and non-market values derived from nighttime satellite imagery. Land Cover, and Ecosystem Service Valuation, Ecological Economics 41(3), 509-527.
UN (United Nations) (2001) World Demographic Trends: Report of the Secretary General, United Nations Publication no. E/CN.9/2001/4, http://www.un.org/documents/ecosoc/cn9/2001/ecn92001-4.pdf, (accessed Nov. 2001).
UN (United Nations) (2002) World Population Prospects: The 2000 Revision, United Nations, New York.
UN (United Nations) (1998) World Population Prospects: The 1996 Revision, United Nations, New York, 839 pp.
US Census Bureau, (2002) State Population Projections, http://www.census.gov/population/www/projections/stproj.html, accessed, October 2002.
World Bank (2000) World Development Indicators, Washington D.C., 389 pp.
WRI (World Resources Institute, 1997) World Resources 1996-97, Washington, DC.
Tables
Table 1: World Population Projections (billions) Used By The SRES Report*
Year
|
UN 1998 Long Range
Medium (B2 Scenario) |
IIASA 1996 Rapid
Transition (A1, B1
Scenarios) |
IIASA 1996 Slow
Transition (A2 Scenario) |
|
1995 |
5.687 |
5.702 |
5.702 |
|
2000 |
6.091 |
6.110 |
6.170 |
|
2005 |
6.491 |
6.480 |
6.665 |
|
2010 |
6.891 |
6.850 |
7.168 |
|
2015 |
7.286 |
7.211 |
7.678 |
|
2020 |
7.672 |
7.547 |
8.191 |
|
2025 |
8.039 |
7.838 |
8.715 |
|
2030 |
8.372 |
8.072 |
9.247 |
|
2035 |
8.670 |
8.239 |
9.779 |
|
2040 |
8.930 |
8.371 |
10.300 |
|
2045 |
9.159 |
8.456 |
10.800 |
|
2050 |
9.367 |
8.488 |
11.300 |
|
2055 |
9.545 |
8.465 |
11.780 |
|
2060 |
9.704 |
8.391 |
12.250 |
|
2065 |
9.841 |
8.275 |
12.710 |
|
2070 |
9.960 |
8.121 |
13.140 |
|
2075 |
10.066 |
7.933 |
13.540 |
|
2080 |
10.158 |
7.714 |
13.900 |
|
2085 |
10.239 |
7.466 |
14.220 |
|
2090 |
10.306 |
7.174 |
14.530 |
|
2095 |
10.364 |
6.850 |
14.810 |
|
2100 |
10.414 |
6.507 |
15.070 |
* These
projections were those available at the time of, and adopted by, the SRES
report, 1996-1998. More recent projections by the UN and IIASA will have
differences (UN, 2001, O’Neill et al, 2001).
Table 2: SRES Model Disaggregation of the Four SRES Reporting Regions.
|
Model |
REF |
OECD 1990 |
ASIA |
ALM |
|
Asia Pacific
Integrated Model (AIM), Nat’l
Inst. Env. Studies, Japan |
(1)Economies in Transition |
(2)OECD-West, (3)USA, (4)Oceania, (5)Japan |
(6)S.E. Asia, (7)Centrally Planned Asia (CPA) |
(8)Middle East, (9)Africa, (10)Latin America |
|
Atmospheric
Stabilization Framework Model (ASF), ICF Consulting, U.S.A. |
(1)Centrally Planned Europe |
(2)OECD-West, (3)USA, (4)OECD-Asia Pacific |
(5)S.E. Asia, (6)CPA |
(7)Middle East, (8)Africa, (9)Latin America |
|
Integrated
Model to Assess the Greenhouse Effect (IMAGE), Nat’l Inst. Public Health
& Env. Hygiene, Netherlands |
(1)FSU, (2)Eastern Europe |
(3)OECD-Europe, (4)Canada, (5)USA, (6)Oceania,
(7)Japan |
(8)E. Asia, (9)S. Asia, (10)CPA |
(11)Middle East, (12)Africa, (13)Latin America |
|
Model for
Energy Supply Strategy Alternatives & Gen’l Env. Impact (MESSAGE), Int’l
Inst. Applied Systems Analysis, IIASA, Austria |
(1)FSU, (2)Eastern Europe |
(3)Western Europe, (4)N. America, (5)Pacific OECD |
(6)P. Asia, (7)S. Asia, (8)CPA |
(9)ME+N. Africa, (10)SSA, (11)Latin America |
|
Multi-regional
Approach Resource & Industry Allocation (MARIA), Sci. U. Tokyo, Japan |
(1)FSU, (2)Eastern Europe |
(3)Other OECD, (4)N. America, (5)Japan |
(6)ASEAN & other Asia, (7)S. Asia, (8)China |
(9)ALM & Others |
|
Mini Climate
Assessment Model (MiniCAM), Pac. NW Nat’l Lab., USA |
(1)Centrally Planned Europe |
(2)OECD-Europe, (3)Canada, (4)USA, (5)Oceania,
(6)Japan |
(7)S.E. Asia, (8)CPA |
(9)Middle East, (10)Africa, (11)Latin America |
Table 3: Features of Population Projections by UN,
IIASA, World Bank & USCB*
|
|
United States Census Bureau (USCB) 1996 |
World Bank (WB) 1996 |
United Nations (UN) Revision 1996 |
UN Long Range 1998 |
IIASA 1996 |
|
Base
year for projection |
1995 |
1995 |
1995 |
1995 |
1995 |
|
Forecast
period |
2050 |
2150 |
2050 |
2150 |
2100 |
|
No.
of regions |
Country-level |
Country-level |
Country-level |
9 |
13 |
|
No.
of variants |
1 |
1 |
3 |
5 |
27+ |
|
Fertility
variants |
1 |
1 |
3 |
5 |
3 |
|
Long-range fertility (central case) |
Below 2.1 |
2.1 |
2.1 |
2.1 |
1.9 |
|
Mortality
variants |
1 |
1 |
1 |
1 |
3 |
|
Migration
variants |
1 |
1 |
1 |
1 |
3 |
|
Migration
cutoff year |
? |
2025 |
2025 |
2025 |
2100? (central) |
|
2050
population (central case) |
9.4 |
9.2 |
9.4 |
9.4 |
9.9 |
|
2100
population (central case) |
- |
10.32 |
- |
10.4 |
10.35 |
* These features applied at the time of the SRES
report, 1996-1998 (Gaffin, 1998). Some characteristics may have changed in more
recent projections (UN, 2001, O’Neill et al, 2001).[9]
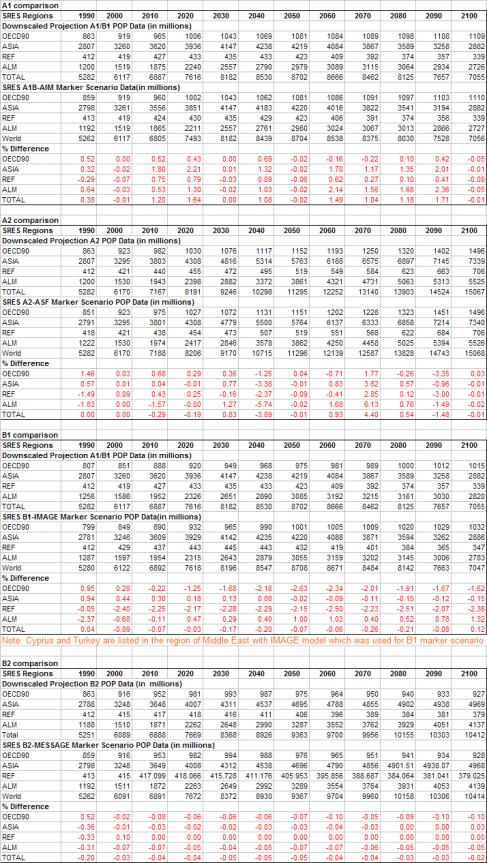
Tables 4 a-d: Comparison of Regional Population Totals from SRES Report with Summed Downscaled Data
Appendix 1. Comparison of Downscaling
Population with SRES Regional Totals
A1 Population Downscaling Compared with SRES Regional Totals:
The percent differences between the A1 downscaling and the SRES regional
population totals are shown in Table 4-a. As with B2, the differences are very
small, but in a few cases rise to 1-2%. As noted above, the marker model for
the A1 scenario (AIM; Table 2) has a different regional disaggregation than the
IIASA population projection. In adapting the IIASA population totals to the AIM
model, small differences in population from the original IIASA data probably
were introduced.
B1 Population Downscaling Compared with SRES Regional Totals:
The B1 population downscaling
regional sums (Table 4-c) show reasonable agreement with the SRES marker model
(IMAGE from RIVM). It should be noted for this projection that IMAGE placed
Turkey and Cyprus in the Middle East region, as opposed to OECD, as is typical
with the other SRES marker models. When calculating the regional sums for B1 we
therefore placed Turkey and Cyprus in the Middle East. For all the other
population projections it was placed in OECD.
The marker model for the B1 scenario (IMAGE; Table 2) has a different
regional disaggregation than the IIASA population projection. In adapting the
IIASA population projections to the RIVM model, small differences in population
may have been introduced.
A2 Population Downscaling Compared with
SRES Regional Totals:
The A2 population downscaling again compares generally well (Table 4-b), but with some isolated years of discrepancies of 5-6%. This again is probably due to small differences introduced by the marker model in this case (ASF, Table 2), when it adapted the IIASA regional population projections to the different ASF model regions. In addition, the ASF model computed results in 25-year intervals so the errors shown may also be due to interpolation factors specific to the model.
B2 Population Downscaling Compared with SRES Regional Totals: In Table 4-d we show the result of re-aggregating our downscaled B2 population estimates from the above website, and then comparing these sums to the aggregated totals in the SRES report. As seen, the differences are extremely small, if not zero, and apart from the base year, are on the order of less than 0.1%. The slightly larger base year differences (<0.5%) are due to the fact that 1990 is not the base year for the 1998 UN Long Range projection used in the SRES report – which is 1995. As indicated above, we accessed 1990 country-level population data from a recent UN Common Statistics database at: http://unstats.un.org/ in April 2002. The SRES report had to similarly use an independent 1990 source for population so that source evidently had small differences with our accessed data.
Tables 5 a-d: Comparison
of Regional GDP Totals from SRES Report with Summed Downscaled GDP Data

Appendix
2. Comparison of the SRES Regional GDP Totals with the Downscaled GDP Data
Regional Totals
A1 GDP Downscaling Compared with SRES
Regional Totals:
Table 5-a presents results for the SRES A1 scenario. We use the regional
economic growth rates from the Asian Pacific Integrated Model (AIM) - the
marker model for the A1 scenario in general.
As
can be seen from Table 5-a, for the base year 1990, the country level data we
have downloaded from the UN and World Bank sources shows some regional
differences from the estimates used by AIM modeling team in the SRES report.
The discrepancy is greatest for the REF region at 7.24%. (The 7.24% base year
difference is exactly maintained throughout the projection period because the
REF region happens to be a single model region in the AIM model (Table 2).) The
other regions show smaller differences. Unlike REF, these differences are not
constant over the projection period because these regions comprise more than
one AIM model region and the changing weights of the model regions affect the
overall SRES reporting region differences.
Generally, the agreement shown is
characteristic of the data available at this time and we deem it acceptable for
an initial version of the database.
A2 GDP Downscaling Compared with SRES
Regional Totals: Table 5-b presents regional totals for our
GDP downscaled projections for the A2 scenario using regional economic growth
rates from the Atmospheric Stabilization Framework (ASF) model from ICF
Consulting in the USA - the marker model for the A2 scenario.
As
seen in Table 5-b, there are significant differences between the summed base
year GDP values for the REF, OECD90 and ALM regions from the A2 marker model as
compared to the country data available currently from the UN and World Bank
sources. Most of these discrepancies, however, can be explained by the fact
that the A2 marker model had significantly different regional estimates for
1990 GDP for REF, OECD90 and ALM, when compared to other marker models in the
SRES report. For example, the ASF model estimate for A2’s 1990 REF GDP is ~13%
lower that the B2 1990 REF GDP used in the MESSAGE marker run. Similarly, the
ASF model estimate for A2’s 1990 OECD GDP is ~6% lower than the B2 1990 OECD
GDP from the MESSAGE marker. Finally, the ASF model estimate for A2 1990 ALM
GDP is ~26% higher than the B2 1990 ALM GDP for the MESSAGE marker. These
differences, combined with the additional, smaller, differences between our
summed country list and the MESSAGE marker sums, explain the overall
discrepancies seen for A2, and the linear downscaling procedure simply
preserves these differences over the projection period. More importantly, these
differences imply that a single base year country GDP list cannot be made
consistent with all the SRES marker models. The SRES report did not require
exact harmonization at the regional level for GDP between the marker models.
A
remedy for our database would be to develop a second base year GDP country list
that is more consistent with the ASF model assumptions. However, presenting
model-specific base year country lists is potentially confusing and difficult
to justify for users, and we have decided to leave the current numbers as they
stand.
B1 GDP Downscaling Compared with SRES
Regional Totals:
Table 5-c presents regional downscaled totals for the B1 scenario using
regional economic growth rates from the Integrated Model to Assess the
Greenhouse Effect (IMAGE) from RIVM in the Netherlands - the marker model for
the B1 scenario.
As
seen in Table 5-c, the regional sums for the data differ significantly in the
REF region. This initial discrepancy is essentially maintained throughout the
downscaling period. The main cause for this discrepancy is similar to the
discrepancies explained for the scenario A2 above – the marker model for B1 had
a large difference in the 1990 GDP estimate for REF compared to the 1990 REF
GDP estimate for the marker models for the other scenarios. Specifically, the
B1 marker 1990 REF GDP is ~10% lower than the B2 marker 1990 REF GDP. The
remainder of the discrepancy for the B1 REF GDP relates to the smaller base
year GDP differences between our country list and the general SRES marker
regional sums.
Once
again this shows that a single country-level base year GDP list cannot be
consistent with all the base year marker model regional GDP estimates.
B2 GDP Downscaling Compared with SRES
Regional Totals:
Table 5-d presents regional comparisons for the SRES B2 scenario. We used the
regional economic growth rates from the IIASA MESSAGE model - the marker model
for the B2 scenario in general.
Table 5-d shows
that the regionally summed GDP values compare fairly well with the regional
sums in the SRES book report. The base year differences are a maximum of about
7% for the REF region and lower for the other regions. These base year
differences are largely preserved throughout the projection period with small
fluctuations due to changing B2 model regional weights.
Captions
Figure 1a (top). Gridded population of the world (GPW) in units of people/unit area (CIESIN et al, 2001). Figure 1b (bottom) A 2025 projection of GPW, using the IPCC SRES B2 population projection data available at the country level.
Figure 2. Changes in the Gridded
Population of the World (GPW) between the years 1990 and 2025, shown in figure
1. The figure highlights the major
growth and decline areas of international population due to varying fertility,
mortality and migration rates. Overall there is a projected increase of world
population of ~2.8 billion people. The distribution of these changes is far
from uniform as evident in the map.
Figure 3a (top): GDP/unit area map with GDP measured using traditional market exchange rate estimates. We projected the base year forward in time (Figure 3b – bottom) using the country-level B2 scenario GDP and population downscaled data described in the first portions of this report.
Figures
Figure 1: Gridded Population of the World (GPW) 1990 and 2025
Figure 2: Gridded Population Change between 2025 and 1990
Figure 3: GDP “density” of the World 1990 and 2025
Endnotes